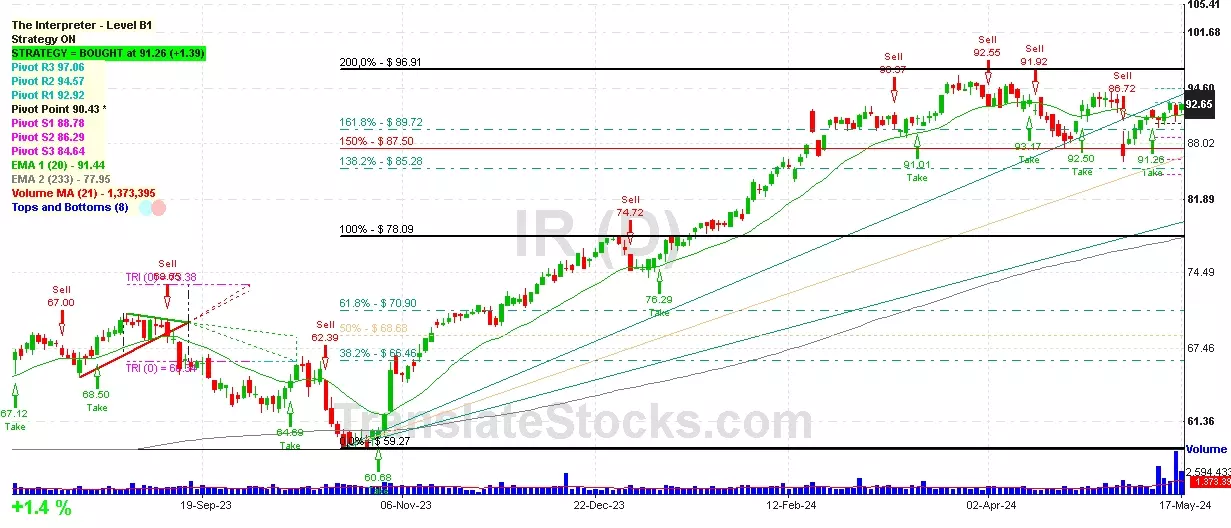
| Date | Price $ | Result % | Candle Name | Side |
|---|---|---|---|---|
| 001 13 May 2024 | Sell Price: 90.84 | Profit: Open Day1 ($ 90.79) | Abandoned Baby | Sell |
| 002 06 May 2024 | Buy Price: 88.48 | Profit: Open Day1 ($ 88.67) | Abandoned Baby | Buy |
| 003 04 Apr 2024 | Sell Price: 92.30 | Loss: Close Day2 ($ 94.01) | Engulfing | Sell |
| 004 04 Apr 2024 | Sell Price: 92.69 | Loss: Close Day2 ($ 94.01) | Dark Cloud Cover | Sell |
| 005 27 Feb 2024 | Sell Price: 90.42 | Profit: Open Day1 ($ 90.33) | Engulfing | Sell |
| 006 27 Feb 2024 | Sell Price: 90.38 | Profit: Open Day1 ($ 90.33) | Dark Cloud Cover | Sell |
| 007 26 Feb 2024 | Buy Price: 90.76 | Profit: Open Day1 ($ 90.95) | Piercing Line | Buy |
| 008 23 Feb 2024 | Sell Price: 90.53 | Profit: Open Day1 ($ 90.33) | Dark Cloud Cover | Sell |
| 009 20 Feb 2024 | Sell Price: 86.74 | Loss: Close Day2 ($ 90.79) | Abandoned Baby | Sell |
| 010 23 Jan 2024 | Sell Price: 79.21 | Profit: Close Day1 ($ 78.84) | Dark Cloud Cover | Sell |
| 011 27 Oct 2023 | Sell Price: 59.38 | Loss: Close Day2 ($ 60.68) | Engulfing | Sell |
| 012 06 Oct 2023 | Buy Price: 63.42 | Profit: Close Day1 ($ 64.10) | Engulfing | Buy |
| 013 06 Oct 2023 | Buy Price: 63.50 | Profit: Close Day1 ($ 64.10) | Piercing Line | Buy |
| 014 18 Sep 2023 | Buy Price: 66.39 | Profit: Open Day2 ($ 66.65) | Engulfing | Buy |
| 015 18 Aug 2023 | Buy Price: 66.49 | Profit: Open Day1 ($ 66.80) | Piercing Line | Buy |
| 016 11 Aug 2023 | Buy Price: 68.09 | Loss: Close Day2 ($ 67.00) | Piercing Line | Buy |
| 017 04 Aug 2023 | Sell Price: 66.91 | Loss: Close Day2 ($ 68.62) | Dark Cloud Cover | Sell |
| 018 12 Jul 2023 | Sell Price: 66.07 | Loss: Close Day2 ($ 66.12) | Engulfing | Sell |
| 019 12 Jul 2023 | Sell Price: 66.11 | Loss: Close Day2 ($ 66.12) | Dark Cloud Cover | Sell |
| 020 07 Jul 2023 | Buy Price: 64.26 | Profit: Open Day1 ($ 64.97) | Engulfing | Buy |
| 021 12 Jun 2023 | Buy Price: 62.85 | Profit: Open Day1 ($ 62.89) | Engulfing | Buy |
| 022 12 Jun 2023 | Buy Price: 62.83 | Profit: Open Day1 ($ 62.89) | Piercing Line | Buy |
| 023 09 Jun 2023 | Sell Price: 62.46 | Profit: Open Day1 ($ 62.27) | Engulfing | Sell |
| 024 30 May 2023 | Sell Price: 58.44 | Profit: Open Day1 ($ 58.10) | Dark Cloud Cover | Sell |
| 025One Year Average | Both Sides Result for 24 Signals |
Loss: $ -6.91 ($ -0.29 / Signal) |
All of Them | Buy + Sell |
| Simple Moving Averages (SMA) Period | Value $ | Signal | Exponential Moving Averages (EMA) Period | Value $ | Signal | |
|---|---|---|---|---|---|---|
| 2 | 92.03 | BUY | 2 | 92.35 | BUY | |
| 3 | 92.28 | BUY | 3 | 92.20 | BUY | |
| 5 | 91.84 | BUY | 5 | 91.93 | BUY | |
| 8 | 91.53 | BUY | 8 | 91.67 | BUY | |
| 13 | 91.01 | BUY | 13 | 91.48 | BUY | |
| 21 | 91.21 | BUY | 21 | 91.44 | BUY | |
| 34 | 91.61 | BUY | 34 | 91.28 | BUY | |
| 55 | 91.84 | BUY | 55 | 90.28 | BUY | |
| 90 | 88.59 | BUY | 90 | 87.62 | BUY | |
| 200 | 77.44 | BUY | 200 | 79.75 | BUY |
Ingersoll-rand Inc
IPO: 2017-05-12
Ticker: IRIndices: S&P 500,
Exchange: New York Stock Exchange, Inc. (US - USD)
Website: https://www.irco.com/
Phone:
Common Stock
Technology (
General Industrial Machinery & Equipment

 Click to Enlarge