| Date | Price $ | Result % | Candle Name | Side |
|---|---|---|---|---|
| 001 01 Apr 2024 | Sell Price: 114.05 | Profit: Open Day1 ($ 112.94) | Abandoned Baby | Sell |
| 002 12 Mar 2024 | Buy Price: 110.60 | Profit: Open Day2 ($ 111.03) | Engulfing | Buy |
| 003 08 Mar 2024 | Sell Price: 110.41 | Profit: Close Day1 ($ 109.88) | Engulfing | Sell |
| 004 21 Feb 2024 | Buy Price: 105.00 | Profit: Open Day1 ($ 106.01) | Engulfing | Buy |
| 005 07 Feb 2024 | Buy Price: 104.26 | Profit: Open Day1 ($ 104.32) | Abandoned Baby | Buy |
| 006 18 Jan 2024 | Buy Price: 96.70 | Profit: Open Day1 ($ 97.36) | Abandoned Baby | Buy |
| 007 16 Jan 2024 | Sell Price: 96.14 | Profit: Open Day1 ($ 95.48) | Abandoned Baby | Sell |
| 008 29 Nov 2023 | Buy Price: 90.18 | Profit: Open Day1 ($ 90.47) | Abandoned Baby | Buy |
| 009 09 Nov 2023 | Sell Price: 85.03 | Loss: Close Day2 ($ 86.38) | Dark Cloud Cover | Sell |
| 010 06 Nov 2023 | Sell Price: 84.35 | Profit: Open Day1 ($ 84.07) | Dark Cloud Cover | Sell |
| 011 18 Sep 2023 | Buy Price: 86.23 | Profit: Close Day1 ($ 86.29) | Engulfing | Buy |
| 012 25 Jul 2023 | Buy Price: 84.47 | Profit: Open Day1 ($ 85.13) | Abandoned Baby | Buy |
| 013 25 Jul 2023 | Buy Price: 84.31 | Profit: Open Day1 ($ 85.13) | Engulfing | Buy |
| 014 20 Jun 2023 | Sell Price: 81.05 | Profit: Open Day1 ($ 80.68) | Abandoned Baby | Sell |
| 015 31 May 2023 | Sell Price: 75.45 | Loss: Close Day2 ($ 77.55) | Abandoned Baby | Sell |
| 016One Year Average | Both Sides Result for 15 Signals |
Profit: $ 3.49 ($ 0.23 / Signal) |
All of Them | Buy + Sell |
| Simple Moving Averages (SMA) Period | Value $ | Signal | Exponential Moving Averages (EMA) Period | Value $ | Signal | |
|---|---|---|---|---|---|---|
| 2 | 117.69 | BUY | 2 | 117.83 | BUY | |
| 3 | 116.55 | BUY | 3 | 116.83 | BUY | |
| 5 | 114.33 | BUY | 5 | 115.56 | BUY | |
| 8 | 113.33 | BUY | 8 | 114.71 | BUY | |
| 13 | 113.69 | BUY | 13 | 114.21 | BUY | |
| 21 | 114.29 | BUY | 21 | 113.72 | BUY | |
| 34 | 113.22 | BUY | 34 | 112.61 | BUY | |
| 55 | 110.88 | BUY | 55 | 110.31 | BUY | |
| 90 | 106.12 | BUY | 90 | 106.47 | BUY | |
| 200 | 95.21 | BUY | 200 | 97.96 | BUY |
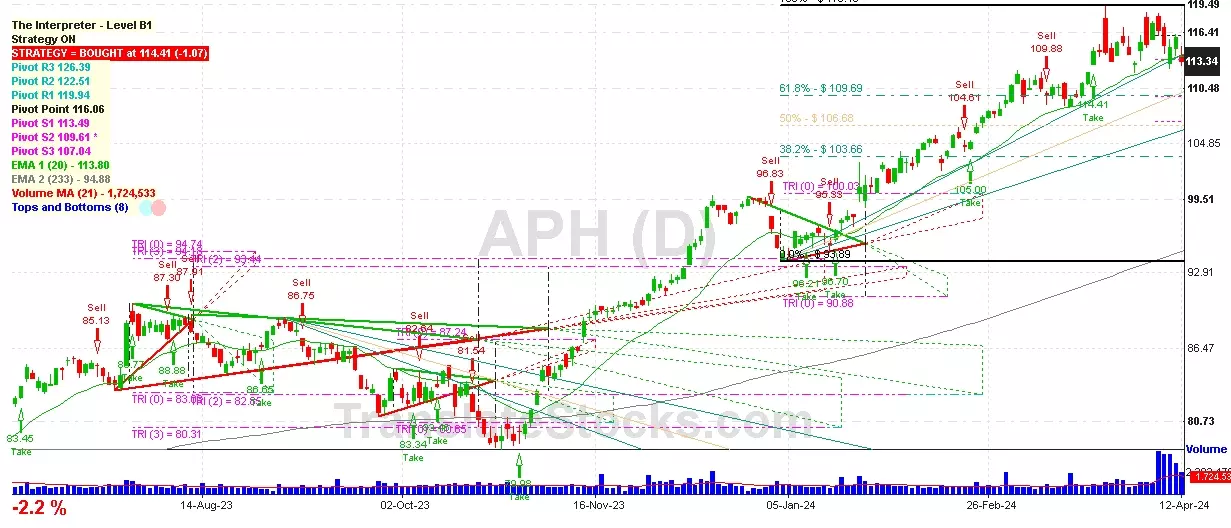
Amphenol Corp-cl A
IPO: 1991-11-08
Ticker: APHIndices: S&P 500,
Exchange: New York Stock Exchange, Inc. (US - USD)
Website: https://www.amphenol.com/
Phone:
Common Stock
Manufacturing (
Electronic Connectors

 Click to Enlarge