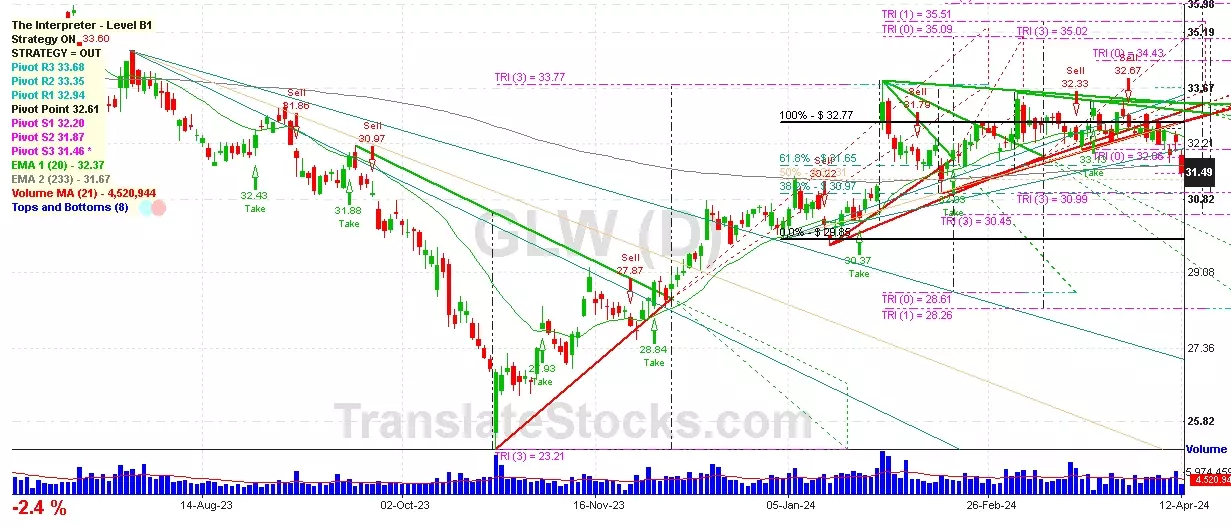
Hey Friend, I'm analysing CORNING INC (GLW), and it is between the Support of $ 31.46 (PivotS3) and the Resistance of $ 31.65 (61.8% of Fibonacci). The stock is also approaching the line of PivotS3 at $ 31.46, and if it goes below this line it could reach the next Support of 50% of Fibonacci at $ 31.31.

| Date | Price $ | Result % | Candle Name | Side |
|---|---|---|---|---|
| 001 11 Apr 2024 | Buy Price: 32.27 | Loss: Close Day2 ($ 31.29) | Abandoned Baby | Buy |
| 002 03 Apr 2024 | Buy Price: 32.57 | Profit: Open Day1 ($ 32.97) | Engulfing | Buy |
| 003 02 Jan 2024 | Buy Price: 30.49 | Loss: Close Day2 ($ 30.29) | Piercing Line | Buy |
| 004 20 Sep 2023 | Sell Price: 31.62 | Profit: Open Day1 ($ 31.39) | Engulfing | Sell |
| 005 15 Sep 2023 | Sell Price: 31.23 | Profit: Open Day1 ($ 31.11) | Abandoned Baby | Sell |
| 006 25 Aug 2023 | Buy Price: 32.43 | Profit: Open Day1 ($ 32.66) | Abandoned Baby | Buy |
| 007 31 Jul 2023 | Buy Price: 33.94 | Loss: Close Day2 ($ 33.81) | Piercing Line | Buy |
| 008 01 Jun 2023 | Buy Price: 30.87 | Profit: Open Day1 ($ 31.22) | Abandoned Baby | Buy |
| 009 10 May 2023 | Buy Price: 31.29 | Loss: Close Day2 ($ 30.99) | Abandoned Baby | Buy |
| 010One Year Average | Both Sides Result for 9 Signals |
Loss: $ -0.28 ($ -0.03 / Signal) |
All of Them | Buy + Sell |
| Simple Moving Averages (SMA) Period | Value $ | Signal | Exponential Moving Averages (EMA) Period | Value $ | Signal | |
|---|---|---|---|---|---|---|
| 2 | 31.44 | SELL | 2 | 31.40 | SELL | |
| 3 | 31.47 | SELL | 3 | 31.41 | SELL | |
| 5 | 31.44 | SELL | 5 | 31.41 | SELL | |
| 8 | 31.25 | BUY | 8 | 31.44 | SELL | |
| 13 | 31.51 | SELL | 13 | 31.56 | SELL | |
| 21 | 31.92 | SELL | 21 | 31.75 | SELL | |
| 34 | 32.20 | SELL | 34 | 31.90 | SELL | |
| 55 | 32.22 | SELL | 55 | 31.84 | SELL | |
| 90 | 31.67 | SELL | 90 | 31.60 | SELL | |
| 200 | 30.99 | BUY | 200 | 31.52 | SELL |
Corning Inc
IPO: 1945-05-21
Ticker: GLWIndices: S&P 500,
Exchange: New York Stock Exchange, Inc. (US - USD)
Website: https://www.corning.com/
Phone:
Common Stock
Manufacturing (
Drawing & Insulating Of Nonferrous Wire
 Click to Enlarge