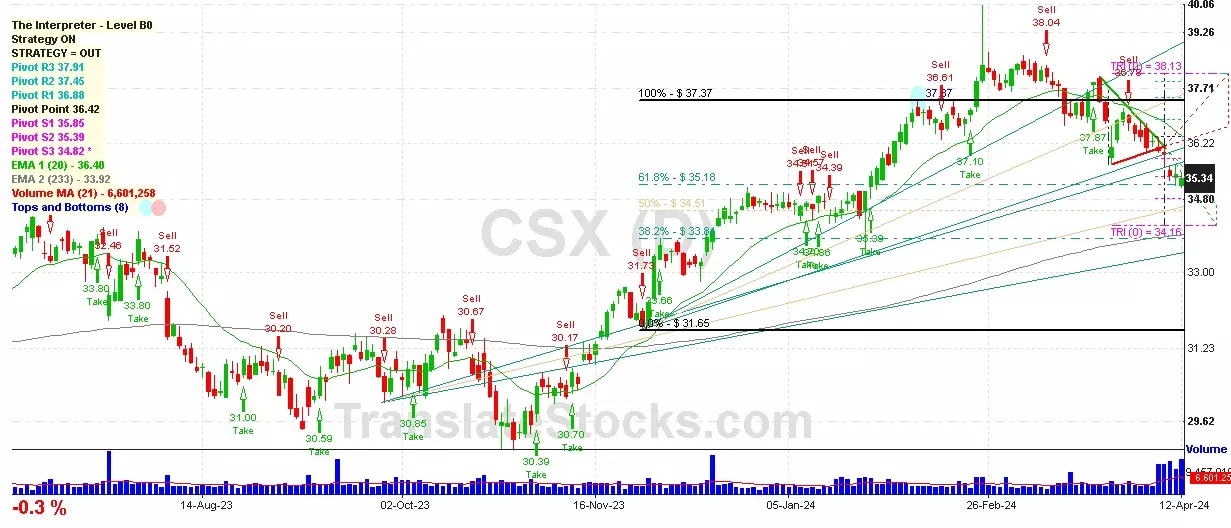
Hey Friend, I'm analysing CSX CORP (CSX), and it is between the Support of $ 35.18 (61.8% of Fibonacci) and the Resistance of $ 35.39 (PivotS2). The stock is also approaching the line of PivotS2 at $ 35.39, and if it goes above this line it could reach the next Resistance of 100% of Fibonacci at $ 37.37.

| Date | Price $ | Result % | Candle Name | Side |
|---|---|---|---|---|
| 001 29 Feb 2024 | Buy Price: 37.94 | Profit: Close Day1 ($ 38.23) | Abandoned Baby | Buy |
| 002 10 Jan 2024 | Buy Price: 34.70 | Profit: Open Day2 ($ 34.72) | Abandoned Baby | Buy |
| 003 08 Nov 2023 | Buy Price: 30.37 | Profit: Open Day1 ($ 30.44) | Abandoned Baby | Buy |
| 004 14 Aug 2023 | Buy Price: 30.82 | Loss: Close Day2 ($ 30.19) | Engulfing | Buy |
| 005 20 Jul 2023 | Sell Price: 33.69 | Profit: Open Day1 ($ 31.94) | Engulfing | Sell |
| 006 20 Jul 2023 | Sell Price: 33.71 | Profit: Open Day1 ($ 31.94) | Dark Cloud Cover | Sell |
| 007One Year Average | Both Sides Result for 6 Signals |
Profit: $ 3.27 ($ 0.54 / Signal) |
All of Them | Buy + Sell |
| Simple Moving Averages (SMA) Period | Value $ | Signal | Exponential Moving Averages (EMA) Period | Value $ | Signal | |
|---|---|---|---|---|---|---|
| 2 | 33.85 | BUY | 2 | 34.02 | BUY | |
| 3 | 34.14 | SELL | 3 | 34.09 | SELL | |
| 5 | 34.28 | SELL | 5 | 34.22 | SELL | |
| 8 | 34.35 | SELL | 8 | 34.43 | SELL | |
| 13 | 34.77 | SELL | 13 | 34.77 | SELL | |
| 21 | 35.43 | SELL | 21 | 35.24 | SELL | |
| 34 | 36.18 | SELL | 34 | 35.68 | SELL | |
| 55 | 36.69 | SELL | 55 | 35.83 | SELL | |
| 90 | 36.02 | SELL | 90 | 35.49 | SELL | |
| 200 | 33.48 | BUY | 200 | 34.21 | SELL |
Csx Corp
IPO: 1980-11-03
Ticker: CSXIndices: S&P 500,
Nasdaq 100,
Exchange: Nasdaq Nms - Global Market (US - USD)
Website: https://www.csx.com/
Phone:
Common Stock
Energy & Transportation (
Railroads, Line-haul Operating
 Click to Enlarge