| Date | Price $ | Result % | Candle Name | Side |
|---|---|---|---|---|
| 001 27 Mar 2024 | Buy Price: 251.72 | Profit: Open Day1 ($ 252.57) | Abandoned Baby | Buy |
| 002 18 Mar 2024 | Buy Price: 256.22 | Profit: Open Day1 ($ 256.68) | Abandoned Baby | Buy |
| 003 22 Feb 2024 | Sell Price: 256.19 | Profit: Close Day2 ($ 254.55) | Abandoned Baby | Sell |
| 004 21 Dec 2023 | Buy Price: 234.42 | Profit: Open Day1 ($ 234.96) | Engulfing | Buy |
| 005 08 Nov 2023 | Buy Price: 194.81 | Profit: Open Day1 ($ 195.66) | Abandoned Baby | Buy |
| 006 06 Oct 2023 | Buy Price: 192.02 | Profit: Close Day1 ($ 195.75) | Engulfing | Buy |
| 007 06 Oct 2023 | Buy Price: 191.51 | Profit: Close Day1 ($ 195.75) | Piercing Line | Buy |
| 008 21 Jul 2023 | Sell Price: 233.01 | Profit: Open Day1 ($ 232.98) | Abandoned Baby | Sell |
| 009 12 Jul 2023 | Sell Price: 230.97 | Loss: Close Day2 ($ 234.78) | Engulfing | Sell |
| 010 12 Jul 2023 | Sell Price: 231.04 | Loss: Close Day2 ($ 234.78) | Dark Cloud Cover | Sell |
| 011 01 Jun 2023 | Buy Price: 212.21 | Profit: Open Day1 ($ 214.23) | Abandoned Baby | Buy |
| 012 16 May 2023 | Sell Price: 212.69 | Loss: Close Day2 ($ 216.17) | Abandoned Baby | Sell |
| 013 16 May 2023 | Sell Price: 212.46 | Loss: Close Day2 ($ 216.17) | Engulfing | Sell |
| 014 08 May 2023 | Sell Price: 207.08 | Profit: Open Day1 ($ 206.32) | Dark Cloud Cover | Sell |
| 015 28 Apr 2023 | Buy Price: 203.03 | Profit: Open Day1 ($ 203.17) | Engulfing | Buy |
| 016One Year Average | Both Sides Result for 15 Signals |
Profit: $ 0.52 ($ 0.03 / Signal) |
All of Them | Buy + Sell |
| Simple Moving Averages (SMA) Period | Value $ | Signal | Exponential Moving Averages (EMA) Period | Value $ | Signal | |
|---|---|---|---|---|---|---|
| 2 | 238.53 | BUY | 2 | 240.21 | BUY | |
| 3 | 240.69 | BUY | 3 | 240.46 | BUY | |
| 5 | 241.59 | SELL | 5 | 241.07 | SELL | |
| 8 | 241.31 | SELL | 8 | 242.06 | SELL | |
| 13 | 244.20 | SELL | 13 | 243.72 | SELL | |
| 21 | 246.88 | SELL | 21 | 245.84 | SELL | |
| 34 | 250.64 | SELL | 34 | 247.50 | SELL | |
| 55 | 252.13 | SELL | 55 | 246.93 | SELL | |
| 90 | 245.68 | SELL | 90 | 242.89 | SELL | |
| 200 | 226.10 | BUY | 200 | 233.88 | BUY |
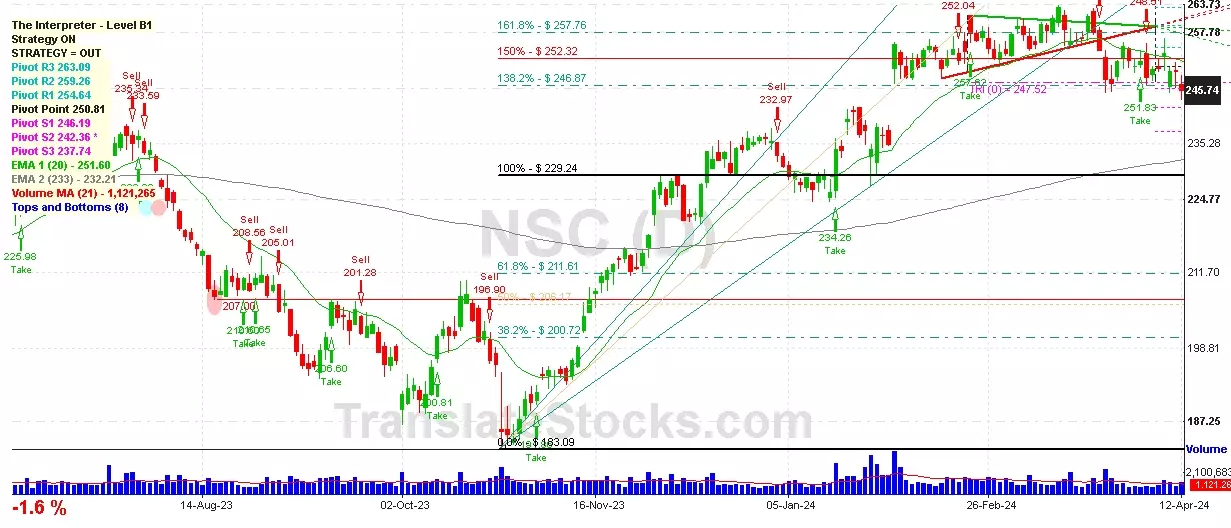
Norfolk Southern Corp
IPO: 1982-06-02
Ticker: NSCIndices: S&P 500,
Exchange: New York Stock Exchange, Inc. (US - USD)
Website: http://www.nscorp.com/
Phone:
Common Stock
Energy & Transportation (
Railroads, Line-haul Operating

 Click to Enlarge