| Date | Price $ | Result % | Candle Name | Side |
|---|---|---|---|---|
| 001 03 Apr 2024 | Buy Price: 237.84 | Profit: Open Day1 ($ 240.98) | Engulfing | Buy |
| 002 03 Apr 2024 | Buy Price: 237.50 | Profit: Open Day1 ($ 240.98) | Piercing Line | Buy |
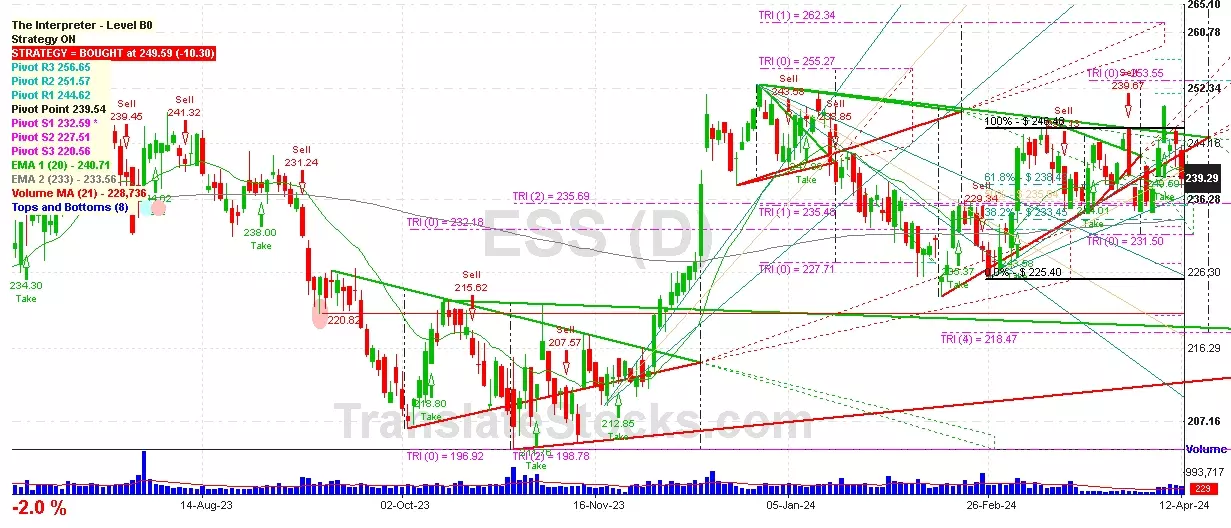
| 003 01 Apr 2024 | Sell Price: 239.67 | Profit: Open Day1 ($ 238.03) | Engulfing | Sell |
| 004 15 Mar 2024 | Buy Price: 239.07 | Profit: Open Day1 ($ 240.12) | Piercing Line | Buy |
| 005 13 Mar 2024 | Buy Price: 242.34 | Loss: Close Day2 ($ 239.07) | Engulfing | Buy |
| 006 14 Feb 2024 | Buy Price: 227.26 | Profit: Open Day1 ($ 229.71) | Abandoned Baby | Buy |
| 007 12 Sep 2023 | Buy Price: 225.66 | Loss: Close Day2 ($ 225.10) | Piercing Line | Buy |
| 008 12 Jun 2023 | Sell Price: 231.83 | Profit: Open Day1 ($ 230.01) | Abandoned Baby | Sell |
| 009One Year Average | Both Sides Result for 8 Signals |
Profit: $ 9.75 ($ 1.22 / Signal) |
All of Them | Buy + Sell |
| Simple Moving Averages (SMA) Period | Value $ | Signal | Exponential Moving Averages (EMA) Period | Value $ | Signal | |
|---|---|---|---|---|---|---|
| 2 | 247.48 | SELL | 2 | 246.62 | BUY | |
| 3 | 245.70 | BUY | 3 | 245.47 | BUY | |
| 5 | 242.43 | BUY | 5 | 243.49 | BUY | |
| 8 | 238.94 | BUY | 8 | 241.87 | BUY | |
| 13 | 240.32 | BUY | 13 | 240.81 | BUY | |
| 21 | 240.01 | BUY | 21 | 240.17 | BUY | |
| 34 | 240.16 | BUY | 34 | 239.49 | BUY | |
| 55 | 237.37 | BUY | 55 | 238.41 | BUY | |
| 90 | 239.28 | BUY | 90 | 236.51 | BUY | |
| 200 | 231.65 | BUY | 200 | 233.51 | BUY |
Essex Property Trust Inc
IPO: 1994-06-07
Ticker: ESSIndices: S&P 500,
Exchange: New York Stock Exchange, Inc. (US - USD)
Website: https://www.essexapartmenthomes.com/
Phone:
REIT (Real Estate Investment Trust)
Real Estate & Construction (
Real Estate Investment Trusts

 Click to Enlarge