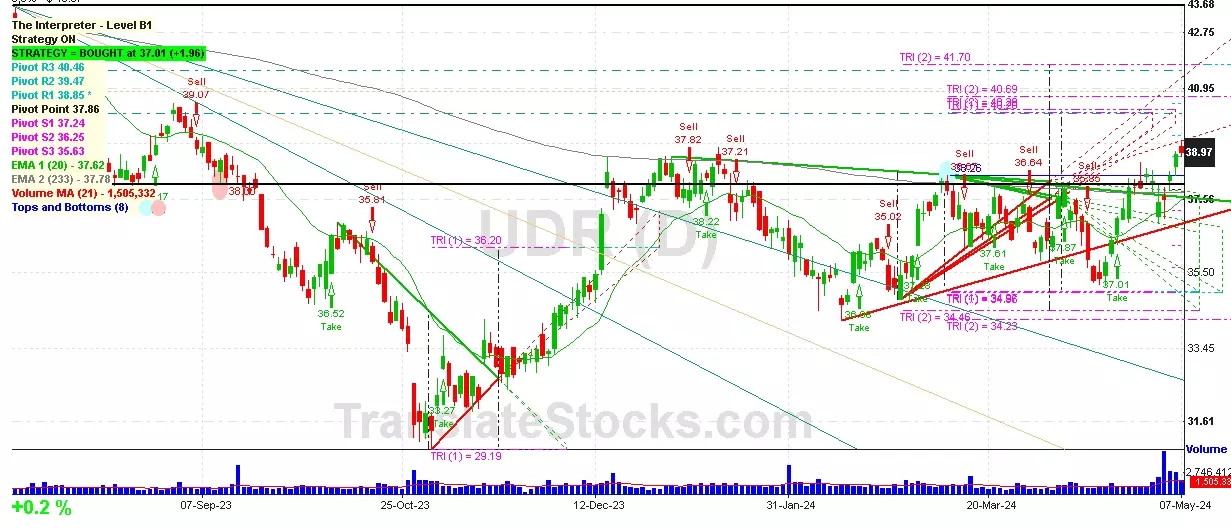
Hey Friend, I'm analysing UDR INC (UDR), and it is between the Support of $ 38.85 (PivotR1) and the Resistance of $ 39.45 (-38.2% of Fibonacci). The stock is also approaching the line of PivotR1 at $ 38.85, and if it goes below this line it could reach the next Support of 0% of Fibonacci at $ 38.26.

| Date | Price $ | Result % | Candle Name | Side |
|---|---|---|---|---|
| 001 15 Mar 2024 | Buy Price: 37.17 | Profit: Open Day1 ($ 37.19) | Piercing Line | Buy |
| 002 13 Feb 2024 | Sell Price: 34.62 | Loss: Close Day2 ($ 36.05) | Abandoned Baby | Sell |
| 003 08 Feb 2024 | Buy Price: 35.49 | Profit: Close Day2 ($ 35.57) | Engulfing | Buy |
| 004 16 Jan 2024 | Sell Price: 38.34 | Profit: Open Day1 ($ 37.70) | Abandoned Baby | Sell |
| 005 31 Oct 2023 | Buy Price: 31.81 | Profit: Open Day2 ($ 32.02) | Piercing Line | Buy |
| 006 20 Sep 2023 | Buy Price: 37.93 | Loss: Close Day2 ($ 36.23) | Abandoned Baby | Buy |
| 007 12 Sep 2023 | Buy Price: 38.73 | Profit: Open Day1 ($ 38.86) | Engulfing | Buy |
| 008 26 Jun 2023 | Buy Price: 41.49 | Profit: Open Day1 ($ 41.62) | Engulfing | Buy |
| 009One Year Average | Both Sides Result for 8 Signals |
Loss: $ -1.92 ($ -0.24 / Signal) |
All of Them | Buy + Sell |
| Simple Moving Averages (SMA) Period | Value $ | Signal | Exponential Moving Averages (EMA) Period | Value $ | Signal | |
|---|---|---|---|---|---|---|
| 2 | 38.93 | BUY | 2 | 38.85 | BUY | |
| 3 | 38.70 | BUY | 3 | 38.70 | BUY | |
| 5 | 38.23 | BUY | 5 | 38.46 | BUY | |
| 8 | 38.18 | BUY | 8 | 38.21 | BUY | |
| 13 | 37.84 | BUY | 13 | 37.90 | BUY | |
| 21 | 37.29 | BUY | 21 | 37.59 | BUY | |
| 34 | 37.13 | BUY | 34 | 37.31 | BUY | |
| 55 | 36.92 | BUY | 55 | 37.07 | BUY | |
| 90 | 36.93 | BUY | 90 | 36.90 | BUY | |
| 200 | 36.73 | BUY | 200 | 37.43 | BUY |
Udr Inc
IPO: 1990-05-07
Ticker: UDRIndices: S&P 500,
Exchange: New York Stock Exchange, Inc. (US - USD)
Website: https://www.udr.com/
Phone:
REIT (Real Estate Investment Trust)
Real Estate & Construction (
Real Estate Investment Trusts
 Click to Enlarge