| Date | Price $ | Result % | Candle Name | Side |
|---|---|---|---|---|
| 001 10 Apr 2024 | Sell Price: 400.76 | Profit: Open Day1 ($ 400.48) | Abandoned Baby | Sell |
| 002 03 Apr 2024 | Buy Price: 414.00 | Profit: Open Day1 ($ 418.00) | Abandoned Baby | Buy |
| 003 19 Mar 2024 | Buy Price: 388.66 | Profit: Close Day1 ($ 396.47) | Engulfing | Buy |
| 004 14 Mar 2024 | Sell Price: 388.61 | Profit: Close Day1 ($ 387.21) | Engulfing | Sell |
| 005 12 Mar 2024 | Buy Price: 388.18 | Profit: Open Day1 ($ 388.91) | Abandoned Baby | Buy |
| 006 12 Feb 2024 | Buy Price: 392.64 | Loss: Close Day2 ($ 378.04) | Abandoned Baby | Buy |
| 007 26 Jan 2024 | Sell Price: 377.79 | Profit: Open Day1 ($ 375.89) | Abandoned Baby | Sell |
| 008 27 Oct 2023 | Sell Price: 289.91 | Loss: Close Day2 ($ 303.61) | Engulfing | Sell |
| 009 25 Sep 2023 | Buy Price: 328.84 | Loss: Close Day2 ($ 322.14) | Piercing Line | Buy |
| 010 08 Aug 2023 | Sell Price: 348.26 | Profit: Open Day1 ($ 346.82) | Abandoned Baby | Sell |
| 011One Year Average | Both Sides Result for 10 Signals |
Loss: $ -17.44 ($ -1.74 / Signal) |
All of Them | Buy + Sell |
| Simple Moving Averages (SMA) Period | Value $ | Signal | Exponential Moving Averages (EMA) Period | Value $ | Signal | |
|---|---|---|---|---|---|---|
| 2 | 421.55 | SELL | 2 | 420.73 | SELL | |
| 3 | 422.36 | SELL | 3 | 420.04 | BUY | |
| 5 | 417.69 | BUY | 5 | 417.50 | BUY | |
| 8 | 411.54 | BUY | 8 | 414.28 | BUY | |
| 13 | 407.05 | BUY | 13 | 411.15 | BUY | |
| 21 | 408.91 | BUY | 21 | 408.10 | BUY | |
| 34 | 403.46 | BUY | 34 | 404.16 | BUY | |
| 55 | 397.45 | BUY | 55 | 398.11 | BUY | |
| 90 | 391.58 | BUY | 90 | 388.43 | BUY | |
| 200 | 357.95 | BUY | 200 | 368.84 | BUY |
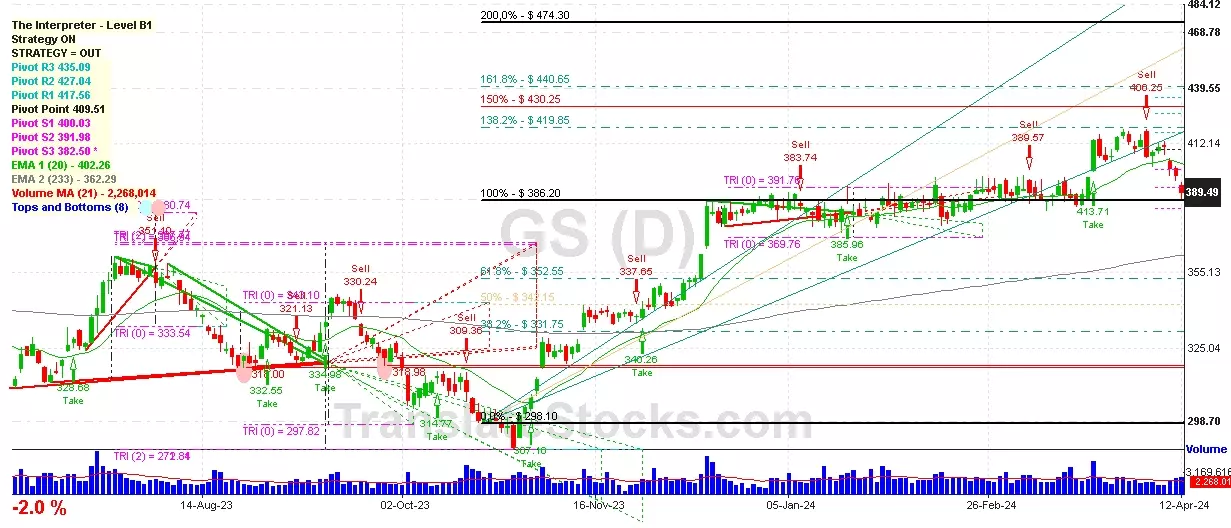
Goldman Sachs Group Inc
IPO: 1999-05-04
Common Stock
Finance (
Security Brokers, Dealers & Flotation Companies

 Click to Enlarge