| Date | Price $ | Result % | Candle Name | Side |
|---|---|---|---|---|
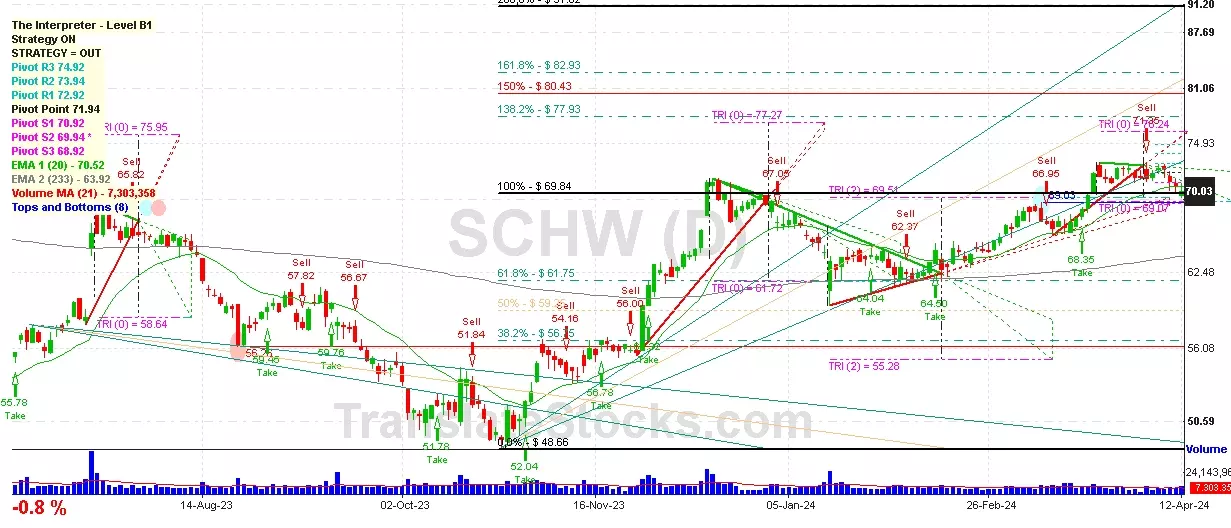
| 001 09 Apr 2024 | Sell Price: 72.28 | Profit: Open Day1 ($ 71.55) | Dark Cloud Cover | Sell |
| 002 15 Mar 2024 | Buy Price: 67.04 | Profit: Close Day1 ($ 67.40) | Engulfing | Buy |
| 003 05 Jan 2024 | Buy Price: 67.23 | Profit: Close Day1 ($ 67.80) | Abandoned Baby | Buy |
| 004 02 Jan 2024 | Buy Price: 69.10 | Loss: Close Day2 ($ 66.89) | Piercing Line | Buy |
| 005 14 Nov 2023 | Buy Price: 54.79 | Profit: Open Day1 ($ 55.30) | Abandoned Baby | Buy |
| 006 30 Jun 2023 | Sell Price: 56.68 | Profit: Open Day1 ($ 56.64) | Engulfing | Sell |
| 007 30 Jun 2023 | Sell Price: 56.79 | Profit: Open Day1 ($ 56.64) | Dark Cloud Cover | Sell |
| 008 26 Jun 2023 | Buy Price: 53.41 | Profit: Open Day1 ($ 53.74) | Abandoned Baby | Buy |
| 009 21 Jun 2023 | Buy Price: 53.97 | Loss: Close Day2 ($ 53.17) | Piercing Line | Buy |
| 010One Year Average | Both Sides Result for 9 Signals |
Loss: $ -0.32 ($ -0.04 / Signal) |
All of Them | Buy + Sell |
| Simple Moving Averages (SMA) Period | Value $ | Signal | Exponential Moving Averages (EMA) Period | Value $ | Signal | |
|---|---|---|---|---|---|---|
| 2 | 75.04 | SELL | 2 | 74.95 | SELL | |
| 3 | 75.10 | SELL | 3 | 74.85 | BUY | |
| 5 | 74.60 | BUY | 5 | 74.51 | BUY | |
| 8 | 73.94 | BUY | 8 | 73.99 | BUY | |
| 13 | 72.83 | BUY | 13 | 73.32 | BUY | |
| 21 | 72.49 | BUY | 21 | 72.44 | BUY | |
| 34 | 71.03 | BUY | 34 | 71.22 | BUY | |
| 55 | 68.73 | BUY | 55 | 69.60 | BUY | |
| 90 | 67.61 | BUY | 90 | 67.55 | BUY | |
| 200 | 62.49 | BUY | 200 | 64.76 | BUY |
Schwab (charles) Corp
IPO: 2010-03-05
Ticker: SCHWIndices: S&P 500,
Exchange: New York Stock Exchange, Inc. (US - USD)
Website: http://www.aboutschwab.com/
Phone:
Common Stock
Finance (
Security Brokers, Dealers & Flotation Companies
 Click to Enlarge