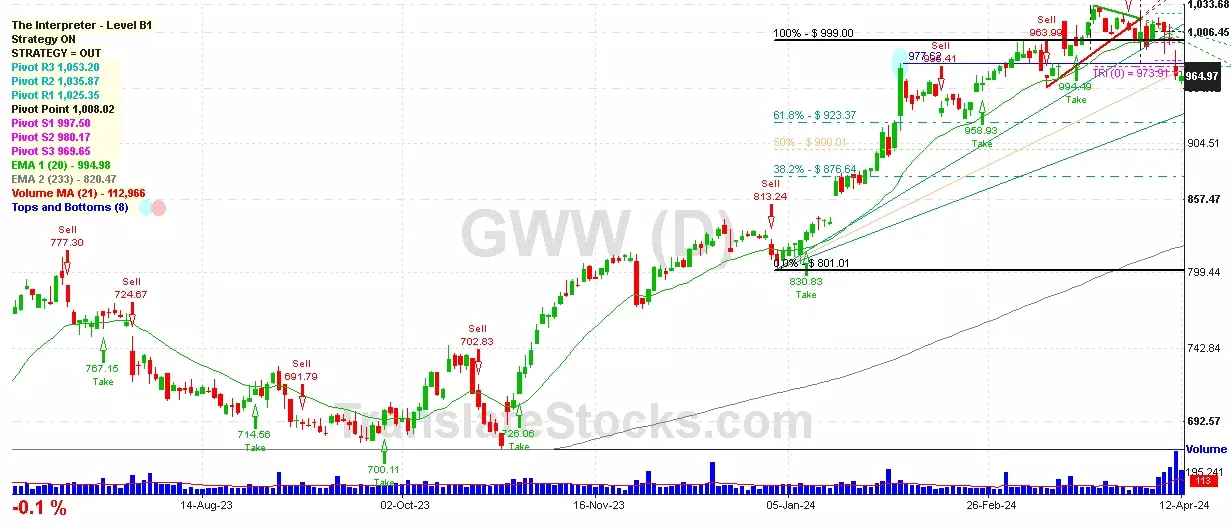
Hey Friend, I'm analysing WW GRAINGER INC (GWW), and it is between the Support of $ 923.37 (61.8% of Fibonacci) and the Resistance of $ 969.65 (PivotS3). The stock is also approaching the line of PivotS3 at $ 969.65, and if it goes above this line it could reach the next Resistance of Triangle projection at $973.91.

| Date | Price $ | Result % | Candle Name | Side |
|---|---|---|---|---|
| 001 12 Mar 2024 | Buy Price: 972.43 | Profit: Open Day1 ($ 974.13) | Abandoned Baby | Buy |
| 002 01 Mar 2024 | Buy Price: 980.90 | Profit: Close Day1 ($ 987.60) | Engulfing | Buy |
| 003 15 Feb 2024 | Sell Price: 943.69 | Profit: Close Day1 ($ 935.80) | Dark Cloud Cover | Sell |
| 004 16 Jan 2024 | Sell Price: 840.55 | Profit: Open Day1 ($ 838.14) | Abandoned Baby | Sell |
| 005 19 Dec 2023 | Sell Price: 830.19 | Profit: Open Day1 ($ 818.43) | Dark Cloud Cover | Sell |
| 006 26 Oct 2023 | Buy Price: 699.67 | Profit: Open Day1 ($ 702.25) | Abandoned Baby | Buy |
| 007 14 Sep 2023 | Buy Price: 696.26 | Profit: Open Day1 ($ 696.96) | Abandoned Baby | Buy |
| 008 12 Sep 2023 | Sell Price: 686.53 | Profit: Open Day1 ($ 685.01) | Abandoned Baby | Sell |
| 009 28 Aug 2023 | Sell Price: 710.22 | Profit: Open Day1 ($ 707.78) | Engulfing | Sell |
| 010 28 Aug 2023 | Sell Price: 710.67 | Profit: Open Day1 ($ 707.78) | Dark Cloud Cover | Sell |
| 011 22 May 2023 | Sell Price: 671.30 | Profit: Open Day1 ($ 666.58) | Abandoned Baby | Sell |
| 012 17 May 2023 | Buy Price: 671.27 | Profit: Open Day1 ($ 673.56) | Abandoned Baby | Buy |
| 013One Year Average | Both Sides Result for 12 Signals |
Profit: $ 47.60 ($ 3.97 / Signal) |
All of Them | Buy + Sell |
| Simple Moving Averages (SMA) Period | Value $ | Signal | Exponential Moving Averages (EMA) Period | Value $ | Signal | |
|---|---|---|---|---|---|---|
| 2 | 953.08 | SELL | 2 | 950.55 | SELL | |
| 3 | 953.98 | SELL | 3 | 950.89 | SELL | |
| 5 | 949.33 | SELL | 5 | 951.25 | SELL | |
| 8 | 948.85 | SELL | 8 | 954.16 | SELL | |
| 13 | 960.46 | SELL | 13 | 961.05 | SELL | |
| 21 | 979.19 | SELL | 21 | 968.67 | SELL | |
| 34 | 985.67 | SELL | 34 | 970.37 | SELL | |
| 55 | 975.88 | SELL | 55 | 958.60 | SELL | |
| 90 | 929.43 | BUY | 90 | 928.83 | BUY | |
| 200 | 823.67 | BUY | 200 | 849.00 | BUY |
Ww Grainger Inc
IPO: 1975-07-29
Ticker: GWWIndices: S&P 500,
Exchange: New York Stock Exchange, Inc. (US - USD)
Website: https://www.grainger.com/
Phone:
Common Stock
Trade & Services (
Wholesale-durable Goods
 Click to Enlarge