| Date | Price $ | Result % | Candle Name | Side |
|---|---|---|---|---|
| 001 26 Feb 2024 | Sell Price: 231.32 | Loss: Close Day2 ($ 238.80) | Engulfing | Sell |
| 002 21 Feb 2024 | Buy Price: 227.79 | Profit: Open Day1 ($ 228.32) | Abandoned Baby | Buy |
| 003 06 Nov 2023 | Sell Price: 194.23 | Loss: Close Day2 ($ 194.68) | Abandoned Baby | Sell |
| 004 05 Sep 2023 | Sell Price: 230.43 | Profit: Open Day1 ($ 230.24) | Engulfing | Sell |
| 005 15 Aug 2023 | Sell Price: 223.84 | Profit: Close Day1 ($ 222.15) | Abandoned Baby | Sell |
| 006 25 Jul 2023 | Sell Price: 233.94 | Profit: Open Day1 ($ 233.70) | Abandoned Baby | Sell |
| 007 05 Jul 2023 | Buy Price: 225.49 | Loss: Close Day2 ($ 221.94) | Engulfing | Buy |
| 008One Year Average | Both Sides Result for 7 Signals |
Loss: $ -8.83 ($ -1.26 / Signal) |
All of Them | Buy + Sell |
| Simple Moving Averages (SMA) Period | Value $ | Signal | Exponential Moving Averages (EMA) Period | Value $ | Signal | |
|---|---|---|---|---|---|---|
| 2 | 230.13 | SELL | 2 | 230.33 | SELL | |
| 3 | 231.27 | SELL | 3 | 230.56 | SELL | |
| 5 | 231.06 | SELL | 5 | 230.77 | SELL | |
| 8 | 230.16 | SELL | 8 | 231.41 | SELL | |
| 13 | 232.33 | SELL | 13 | 233.12 | SELL | |
| 21 | 237.27 | SELL | 21 | 235.37 | SELL | |
| 34 | 241.59 | SELL | 34 | 236.44 | SELL | |
| 55 | 237.98 | SELL | 55 | 234.85 | SELL | |
| 90 | 230.36 | SELL | 90 | 230.74 | SELL | |
| 200 | 220.44 | BUY | 200 | 222.52 | BUY |
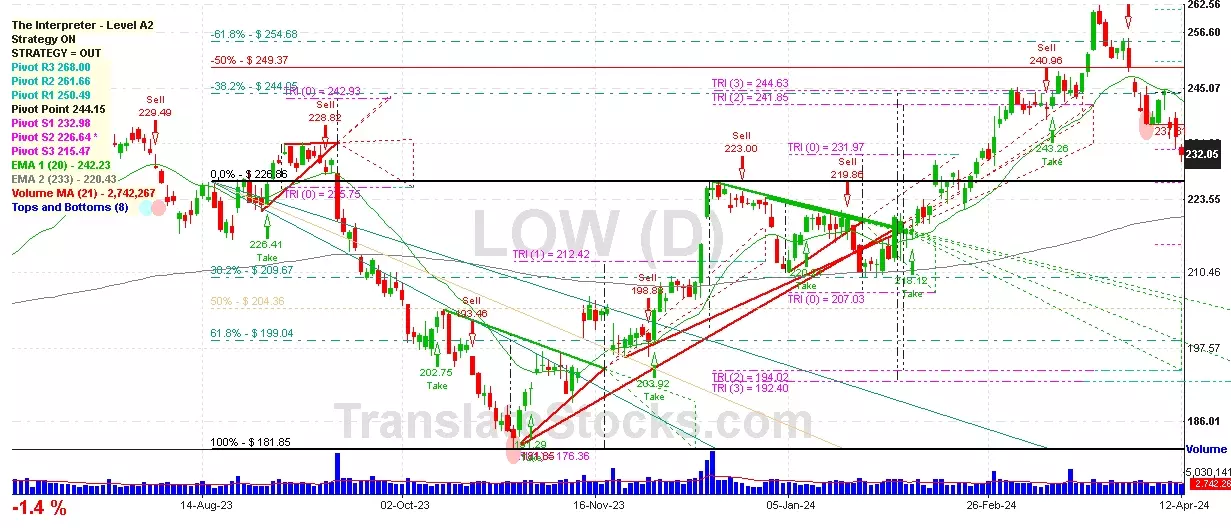
Lowe's Cos Inc
IPO: 1979-12-19
Ticker: LOWIndices: S&P 500,
Exchange: New York Stock Exchange, Inc. (US - USD)
Website: http://www.lowes.com/
Phone:
Common Stock
Trade & Services (
Retail-lumber & Other Building Materials Dealers

 Click to Enlarge