| Date | Price $ | Result % | Candle Name | Side |
|---|---|---|---|---|
| 001 11 Apr 2024 | Buy Price: 288.52 | Profit: Open Day2 ($ 288.82) | Engulfing | Buy |
| 002 10 Apr 2024 | Sell Price: 282.06 | Profit: Open Day1 ($ 282.04) | Abandoned Baby | Sell |
| 003 14 Mar 2024 | Sell Price: 280.00 | Profit: Open Day1 ($ 278.10) | Engulfing | Sell |
| 004 13 Mar 2024 | Buy Price: 284.38 | Profit: Open Day1 ($ 285.84) | Piercing Line | Buy |
| 005 11 Mar 2024 | Sell Price: 284.79 | Profit: Close Day1 ($ 283.88) | Abandoned Baby | Sell |
| 006 21 Feb 2024 | Buy Price: 274.63 | Profit: Open Day1 ($ 278.07) | Piercing Line | Buy |
| 007 29 Jan 2024 | Buy Price: 304.62 | Profit: Close Day1 ($ 307.22) | Piercing Line | Buy |
| 008 18 Jan 2024 | Buy Price: 300.15 | Profit: Open Day1 ($ 301.39) | Abandoned Baby | Buy |
| 009 03 Nov 2023 | Buy Price: 263.70 | Loss: Close Day2 ($ 257.02) | Abandoned Baby | Buy |
| 010 02 Nov 2023 | Sell Price: 258.60 | Profit: Close Day2 ($ 258.50) | Abandoned Baby | Sell |
| 011 13 Oct 2023 | Sell Price: 288.32 | Loss: Close Day2 ($ 290.55) | Abandoned Baby | Sell |
| 012 05 Sep 2023 | Sell Price: 307.20 | Profit: Open Day2 ($ 306.97) | Abandoned Baby | Sell |
| 013 14 Aug 2023 | Buy Price: 299.16 | Loss: Close Day2 ($ 295.15) | Engulfing | Buy |
| 014 31 May 2023 | Sell Price: 278.60 | Profit: Open Day1 ($ 278.22) | Abandoned Baby | Sell |
| 015One Year Average | Both Sides Result for 14 Signals |
Loss: $ -0.34 ($ -0.02 / Signal) |
All of Them | Buy + Sell |
| Simple Moving Averages (SMA) Period | Value $ | Signal | Exponential Moving Averages (EMA) Period | Value $ | Signal | |
|---|---|---|---|---|---|---|
| 2 | 278.54 | BUY | 2 | 278.90 | BUY | |
| 3 | 277.54 | BUY | 3 | 278.11 | BUY | |
| 5 | 276.49 | BUY | 5 | 277.40 | BUY | |
| 8 | 275.57 | BUY | 8 | 277.49 | BUY | |
| 13 | 279.02 | BUY | 13 | 278.34 | BUY | |
| 21 | 280.31 | SELL | 21 | 279.57 | BUY | |
| 34 | 281.56 | SELL | 34 | 280.94 | SELL | |
| 55 | 282.13 | SELL | 55 | 282.42 | SELL | |
| 90 | 288.24 | SELL | 90 | 284.00 | SELL | |
| 200 | 289.91 | SELL | 200 | 285.53 | SELL |
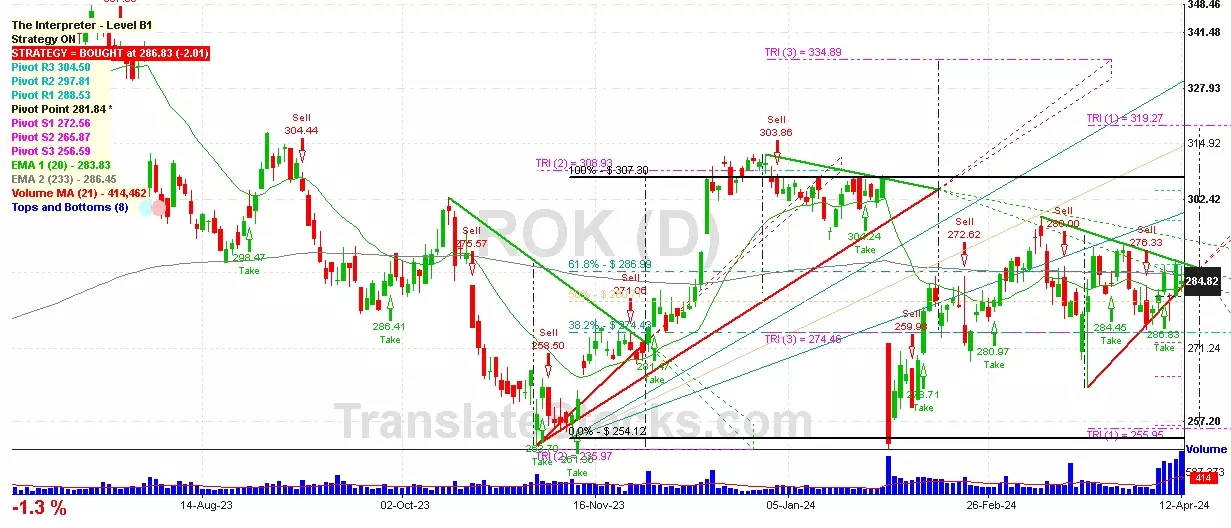
Rockwell Automation Inc
IPO: 1956-08-29
Ticker: ROKIndices: S&P 500,
Exchange: New York Stock Exchange, Inc. (US - USD)
Website: https://www.rockwellautomation.com/
Phone:
Common Stock
Life Sciences (
Measuring & Controlling Devices, Nec
Year | 2021 | 2020 | 2019 | 2018 | 2017 | 2016 | 2015 | 2014 | 2013 | 2012 | 2011 | 2010 | 2009 | 2008 | 2007 | 2006 | |
|---|---|---|---|---|---|---|---|---|---|---|---|---|---|---|---|---|---|
| 1 | Assets + | 10,702 | 7,265 | 6,113 | 6,262 | 7,162 | 7,101 | 6,405 | 6,230 | 5,845 | 5,636 | 5,285 | 4,748 | 4,306 | 4,594 | 624 | 408 |
| 2 | Real Estate Investment Property + | 5 | 5 | 4 | 5 | 5 | 4 | 4 | 4 | 4 | 4 | 4 | 5 | 5 | 0 | 0 | 0 |
| 3 | Real Estate Investment Property + | 5 | 5 | 4 | 5 | 5 | 4 | 4 | 4 | 4 | 4 | 4 | 5 | 5 | 0 | 0 | 0 |
| 4 | Cash and Cash Equivalents + | 662 | 705 | 1,018 | 619 | 1,411 | 1,526 | 1,427 | 1,191 | 1,201 | 904 | 989 | 813 | 644 | 582 | 624 | 408 |
| 5 | Property + | 582 | 574 | 572 | 577 | 584 | 578 | 606 | 633 | 616 | 587 | 561 | 537 | 532 | 554 | 0 | 0 |
| 6 | Property + | 2,326 | 2,249 | 2,138 | 2,138 | 2,096 | 1,983 | 1,905 | 1,888 | 1,829 | 1,799 | 1,720 | 1,722 | 1,759 | 0 | 0 | 0 |
| 7 | Intangible Assets + | 1,022 | 479 | 194 | 215 | 238 | 255 | 230 | 246 | 213 | 210 | 218 | 217 | 231 | 251 | 0 | 0 |
| 8 | Finite-Lived Intangible Assets + | 978 | 436 | 150 | 172 | 194 | 212 | 186 | 202 | 169 | 166 | 174 | 174 | 164 | 0 | 0 | 0 |
| 9 | Liabilities and Equity + | 10,702 | 7,265 | 6,113 | 6,262 | 7,162 | 7,101 | 6,405 | 6,230 | 5,845 | 5,636 | 5,285 | 4,748 | 4,306 | 4,594 | 1,743 | 1,918 |
| 10 | Liabilities + | 3,502 | 1,836 | 1,937 | 2,788 | 2,496 | 2,425 | 1,328 | 2,017 | 1,724 | 1,689 | 1,330 | 1,222 | 947 | 1,403 | 0 | 0 |
| 11 | Debt and Lease Obligation + | 510 | 25 | 0 | 551 | 350 | 449 | 0 | 325 | 179 | 157 | 0 | 0 | 0 | 100 | 0 | 0 |
| 12 | Stockholders' Equity + | 2,694 | 1,347 | 404 | 1,618 | 2,664 | 1,990 | 2,257 | 2,658 | 2,586 | 1,852 | 1,748 | 1,460 | 1,316 | 1,689 | 1,743 | 1,918 |
| 13 | Stockholders' Equity Attributable to Parent + | 2,390 | 1,028 | 404 | 1,618 | 2,664 | 1,990 | 2,257 | 2,658 | 2,586 | 1,852 | 1,748 | 1,460 | 1,316 | 1,689 | 1,743 | 1,918 |
| 14 | Stockholders' Equity + | 1 | 1 | 1 | 1 | 1 | 1 | 1 | 1 | 1 | 1 | 1 | 1 | 0 | 0 | 0 | 0 |
| 15 | Common Stock + | 1 | 1 | 1 | 1 | 1 | 1 | 1 | 1 | 1 | 1 | 1 | 1 | 0 | 0 | 0 | 0 |
| 16 | Partners' Capital + | 8,000 | 7,140 | 6,440 | 6,198 | 6,103 | 5,668 | 5,317 | 4,840 | 4,333 | 3,859 | 3,383 | 2,912 | 2,667 | 4,486 | 0 | 0 |
| 17 | Partners' Capital + | 8,000 | 7,140 | 6,440 | 6,198 | 6,103 | 5,668 | 5,317 | 4,840 | 4,333 | 3,859 | 3,383 | 2,912 | 2,667 | 4,486 | 0 | 0 |
| 18 | Limited Liability Company (LLC) Members' Equity + | 6,983 | 5,526 | 4,952 | 5,256 | 4,924 | 4,129 | 3,982 | 3,892 | 3,515 | 2,634 | 2,390 | 2,071 | 1,939 | 4,167 | 0 | 0 |
| 19 | Limited Liability Company (LLC) Members' Equity + | 6,983 | 5,526 | 4,952 | 5,256 | 4,924 | 4,129 | 3,982 | 3,892 | 3,515 | 2,634 | 2,390 | 2,071 | 1,939 | 4,167 | 0 | 0 |
| 20 | Current Assets + | 3,063 | 2,686 | 2,986 | 2,831 | 4,421 | 4,185 | 4,048 | 3,934 | 3,680 | 3,388 | 3,075 | 2,587 | 2,135 | 2,437 | 0 | 0 |
| 21 | Cash + | 1 | 1 | 40 | 291 | 1,125 | 903 | 722 | 628 | 373 | 350 | 0 | 0 | 0 | 0 | 0 | 0 |
| 22 | Current Receivables + | 1,424 | 1,249 | 1,179 | 1,190 | 1,136 | 1,079 | 1,041 | 1,216 | 1,186 | 1,187 | 1,063 | 859 | 726 | 960 | 0 | 0 |
| 23 | Inventory + | 798 | 584 | 576 | 582 | 559 | 527 | 536 | 588 | 615 | 619 | 642 | 603 | 436 | 576 | 0 | 0 |
| 24 | Long-Term Assets + | 4,671 | 2,572 | 1,567 | 1,352 | 1,920 | 1,449 | 1,178 | 1,211 | 1,189 | 1,101 | 1,094 | 1,082 | 1,100 | 1,232 | 0 | 0 |
| 25 | Long-term Investments and Receivables + | 1,364 | 954 | 794 | 1,288 | 326 | 0 | 0 | 0 | 0 | 0 | 0 | 0 | 0 | 0 | 0 | 0 |
| 26 | Long-Term Restricted Cash and Investments + | 17 | 26 | 0 | 0 | 0 | 0 | 0 | 0 | 0 | 0 | 0 | 0 | 0 | 0 | 0 | 0 |
| 27 | Current Liabilities + | 2,992 | 1,811 | 1,937 | 2,237 | 2,146 | 1,976 | 1,328 | 1,692 | 1,545 | 1,532 | 1,330 | 1,222 | 947 | 1,303 | 0 | 0 |
| 28 | Long-Term Liabilities + | 4,295 | 2,824 | 2,540 | 1,856 | 1,516 | 1,764 | 1,752 | 1,112 | 1,118 | 1,147 | 1,148 | 1,142 | 1,193 | 1,214 | 0 | 0 |
| 29 | Increase (Decrease) in Stockholders' Equity [Roll Forward] + | -6,709 | -6,510 | -6,438 | -5,502 | -4,080 | -3,909 | -3,459 | -2,927 | -2,568 | -2,380 | -2,205 | -2,136 | -2,110 | -3,976 | 0 | 0 |
| 30 | Treasury Stock Transactions + | -6,709 | -6,510 | -6,438 | -5,502 | -4,080 | -3,909 | -3,459 | -2,927 | -2,568 | -2,380 | -2,205 | -2,136 | -2,110 | -3,976 | 0 | 0 |
| 31 | Treasury Stock + | -6,709 | -6,510 | -6,438 | -5,502 | -4,080 | -3,909 | -3,459 | -2,927 | -2,568 | -2,380 | -2,205 | -2,136 | -2,110 | -3,976 | 0 | 0 |
| 32 | Current Other Assets + | 179 | 148 | 173 | 149 | 191 | 150 | 171 | 147 | 115 | 119 | 182 | 141 | 154 | 129 | 0 | 0 |
| 33 | Total Current Assets + | 3,063 | 2,686 | 2,986 | 2,831 | 4,421 | 4,185 | 4,048 | 3,934 | 3,680 | 3,388 | 3,075 | 2,587 | 2,135 | 2,437 | 0 | 0 |
| 34 | Operating Lease + | 378 | 343 | 0 | 0 | 0 | 0 | 0 | 0 | 0 | 0 | 0 | 0 | 0 | 0 | 0 | 0 |
| 35 | Goodwill + | 3,626 | 1,650 | 1,071 | 1,076 | 1,078 | 1,074 | 1,029 | 1,051 | 1,023 | 949 | 953 | 912 | 913 | 915 | 0 | 0 |
| 36 | Long-Term Other Assets + | 286 | 163 | 132 | 96 | 398 | 375 | 149 | 160 | 166 | 152 | 137 | 142 | 156 | 179 | 0 | 0 |
| 37 | Deferred Income Tax Assets + | 667 | 579 | 496 | 276 | 842 | 0 | 0 | 0 | 0 | 0 | 0 | 0 | 0 | 0 | 0 | 0 |
| 38 | Assets for Plan Benefits + | 0 | 0 | 0 | 0 | 0 | 0 | 0 | 0 | 0 | 0 | 141 | 170 | 187 | 317 | 0 | 0 |
| 39 | Total Assets + | 10,702 | 7,265 | 6,113 | 6,262 | 7,162 | 7,101 | 6,405 | 6,230 | 5,845 | 5,636 | 5,285 | 4,748 | 4,306 | 4,594 | 0 | 0 |
| 40 | Stockholders' Equity Attributable to Noncontrolling Interest + | 304 | 319 | 0 | 0 | 0 | 0 | 0 | 0 | 0 | 0 | 0 | 0 | 0 | 0 | 0 | 0 |
| 41 | Total Stockholders' Equity + | 2,694 | 1,347 | 404 | 1,618 | 2,664 | 0 | 0 | 0 | 0 | 0 | 0 | 0 | 0 | 0 | 0 | 0 |
| 42 | Total Liabilities and Equity + | 10,702 | 7,265 | 6,113 | 6,262 | 7,162 | 7,101 | 6,405 | 6,230 | 5,845 | 5,636 | 5,285 | 4,748 | 4,306 | 4,594 | 0 | 0 |
Year | 2021 | 2020 | 2019 | 2018 | 2017 | 2016 | 2015 | 2014 | 2013 | 2012 | 2011 | 2010 | 2009 | 2008 | 2007 | |
|---|---|---|---|---|---|---|---|---|---|---|---|---|---|---|---|---|
| 1 | 0 | 0 | 0 | 6,666 | 6,311 | 5,880 | 0 | 0 | 0 | 0 | 0 | 0 | 0 | 0 | 0 | |
| 2 | -4,100 | -3,735 | -3,795 | -3,794 | -3,687 | -3,404 | -3,605 | -3,870 | -3,778 | -3,737 | -3,610 | -2,921 | -2,763 | -3,357 | -2,907 | |
| 3 | 2,898 | 2,595 | 2,900 | 2,872 | 2,624 | 2,476 | 2,703 | 2,754 | 2,574 | 2,523 | 2,390 | 1,936 | 1,570 | 2,341 | 2,097 | |
| 4 | 422 | 372 | 379 | 372 | 348 | 319 | 307 | 290 | 261 | 259 | 254 | 199 | 170 | 191 | 0 | |
| 5 | 0 | 0 | 0 | 0 | 0 | 0 | 0 | 5 | 14 | 9 | 4 | 6 | 4 | 2 | 0 | |
| 6 | 0 | 0 | 0 | 0 | 0 | 0 | 0 | -8 | -19 | 0 | 0 | 0 | 0 | 0 | 0 | |
| 7 | 1,680 | 1,480 | 1,538 | 1,599 | 1,592 | 1,467 | 1,506 | 1,570 | 1,538 | 1,492 | 1,461 | 1,323 | 1,228 | 1,482 | 1,279 | |
| 8 | 0 | 12 | -2 | -2 | 0 | -2 | 0 | -1 | 0 | -1 | 1 | -6 | -4 | 5 | 0 | |
| 9 | 0 | 0 | 0 | 0 | 61 | 0 | 0 | 0 | 0 | 0 | 0 | 0 | 0 | 0 | 0 | |
| 10 | 0 | 0 | 0 | 0 | 0 | 0 | 0 | 0 | 0 | 0 | 0 | 0 | 4 | -5 | -5 | |
| 11 | 0 | 0 | 0 | 0 | 0 | 0 | 0 | 0 | 0 | 0 | 0 | 0 | -7 | 18 | 33 | |
| 12 | 397 | 154 | -368 | 90 | 0 | 0 | 0 | 0 | 0 | 0 | 0 | 0 | 0 | 0 | 0 | |
| 13 | 28 | -22 | 36 | 0 | 0 | 0 | 0 | 0 | 0 | 0 | 0 | 0 | 0 | 0 | 0 | |
| 14 | 10 | 9 | 10 | 10 | 9 | 3 | 3 | 2 | 3 | 2 | 4 | 2 | 4 | 4 | 0 | |
| 15 | 2 | 6 | 11 | 24 | 20 | 13 | 11 | 10 | 10 | 8 | 6 | 5 | 10 | 28 | 0 | |
| 16 | 0 | 0 | 0 | 0 | 0 | 0 | 0 | 0 | 0 | 0 | 0 | 0 | 0 | 0 | 0 | |
| 17 | 95 | 104 | 98 | 73 | 76 | 71 | 64 | 59 | 61 | 60 | 60 | 60 | 61 | 68 | 63 | |
| 18 | 0 | 1,136 | 901 | 1,331 | 1,037 | 943 | 1,128 | 1,134 | 981 | 966 | 868 | 544 | 274 | 809 | 789 | |
| 19 | 1,526 | 1,136 | 901 | 1,331 | 1,037 | 943 | 1,128 | 1,134 | 981 | 0 | 0 | 0 | 0 | 0 | 0 | |
| 20 | -182 | -113 | -205 | -795 | -212 | -213 | -300 | -307 | -225 | -229 | -170 | -104 | -56 | -231 | -219 | |
| 21 | 0 | 0 | 0 | 0 | 0 | 0 | 0 | 0 | 0 | 0 | 0 | 21 | 0 | 0 | 0 | |
| 22 | 0 | 0 | 0 | 0 | 0 | 0 | 0 | 0 | 0 | 0 | 0 | 0 | 4 | 0 | 0 | |
| 23 | 0 | 0 | 0 | 0 | 0 | 0 | 0 | 0 | 0 | 0 | 1 | 3 | 0 | 0 | 0 | |
| 24 | 1,344 | 1,023 | 696 | 536 | 0 | 0 | 0 | 0 | 0 | 0 | 0 | 0 | 0 | 0 | 0 | |
| 25 | 14 | 0 | 0 | 0 | 0 | 0 | 0 | 0 | 0 | 0 | 0 | 0 | 0 | 0 | 0 | |
| 26 | Total Net Income (Loss) Attributable to Parent + | 1,358 | 1,023 | 696 | 536 | 826 | 730 | 828 | 827 | 756 | 737 | 698 | 464 | 221 | 578 | 1,488 |
| 27 | 1,356 | 1,022 | 695 | 535 | 0 | 0 | 0 | 0 | 0 | 0 | 0 | 0 | 0 | 0 | 0 | |
| 28 | Total Income (Loss) from Continuing Operations + | 0 | 0 | 0 | 0 | 0 | 0 | 0 | 0 | 756 | 737 | 697 | 440 | 218 | 578 | 569 |
| 29 | Income (Loss) from Discontinued Operations + | 0 | 0 | 0 | 0 | 0 | 0 | 0 | 0 | 0 | 0 | 1 | 3 | 0 | 0 | 0 |
| 30 | Total Income (Loss) from Discontinued Operations + | 0 | 0 | 0 | 0 | 0 | 0 | 0 | 0 | 0 | 0 | 1 | 24 | 3 | 0 | 918 |
| 31 | Income (Loss) from Continuing Operations + | 0 | 0 | 0 | 0 | 0 | 0 | 0 | 0 | 5.43 | 5.20 | 4.88 | 3.09 | 1.54 | 3.94 | 3.59 |
| 32 | 0 | 0 | 0 | 0 | 0 | 0 | 0 | 0 | 0 | 0 | 0 | 0.17 | 0.02 | 0 | 5.78 | |
| 33 | Total Earnings Per Share + | 11.69 | 8.83 | 5.88 | 4.27 | 6.42 | 5.60 | 6.15 | 5.98 | 5.43 | 5.20 | 4.88 | 3.26 | 1.56 | 3.94 | 9.37 |
| 34 | Income (Loss) from Continuing Operations + | 0 | 0 | 0 | 0 | 0 | 0 | 0 | 0 | 5.43 | 5.20 | 4.88 | 3.09 | 1.54 | 3.94 | 3.59 |
| 35 | Income (Loss) from Continuing Operations + | 0 | 0 | 0 | 0 | 0 | 0 | 0 | 0 | 5.36 | 5.13 | 4.79 | 3.05 | 1.53 | 3.90 | 3.53 |
| 36 | 0 | 0 | 0 | 0 | 0 | 0 | 0 | 0 | 0 | 0 | 0.01 | 0.17 | 0.02 | 0 | 5.70 | |
| 37 | Total Earnings Per Share + | 11.58 | 8.77 | 5.83 | 4.21 | 6.35 | 5.56 | 6.09 | 5.91 | 5.36 | 5.13 | 4.80 | 3.22 | 1.55 | 3.90 | 9.23 |
| 38 | 4.28 | 4.08 | 3.88 | 3.51 | 3.04 | 2.90 | 2.60 | 2.32 | 1.98 | 1.74 | 1.48 | 1.22 | 1.16 | 0 | 0 | |
| 39 | 0 | 0 | 0 | 0 | 0 | 0 | 0 | 0 | 0 | 0 | 0 | 0 | 4 | 0 | 0 |

 Click to Enlarge