
| Date | Price $ | Result % | Candle Name | Side |
|---|---|---|---|---|
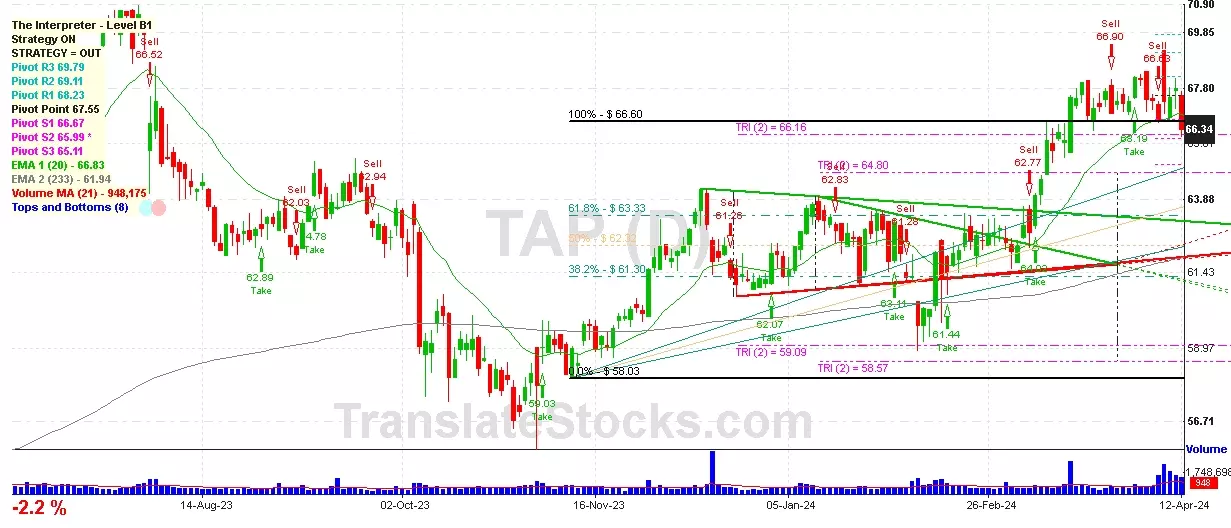
| 001 06 Mar 2024 | Sell Price: 62.77 | Loss: Close Day2 ($ 64.56) | Dark Cloud Cover | Sell |
| 002 04 Mar 2024 | Buy Price: 62.34 | Profit: Open Day1 ($ 62.58) | Piercing Line | Buy |
| 003 29 Feb 2024 | Sell Price: 62.42 | Profit: Open Day1 ($ 62.38) | Abandoned Baby | Sell |
| 004 21 Feb 2024 | Sell Price: 62.47 | Profit: Open Day1 ($ 62.00) | Dark Cloud Cover | Sell |
| 005 19 Oct 2023 | Sell Price: 58.34 | Profit: Close Day2 ($ 57.62) | Engulfing | Sell |
| 006 24 Aug 2023 | Sell Price: 62.54 | Loss: Close Day2 ($ 62.89) | Engulfing | Sell |
| 007One Year Average | Both Sides Result for 6 Signals |
Loss: $ -0.67 ($ -0.11 / Signal) |
All of Them | Buy + Sell |
| Simple Moving Averages (SMA) Period | Value $ | Signal | Exponential Moving Averages (EMA) Period | Value $ | Signal | |
|---|---|---|---|---|---|---|
| 2 | 63.26 | SELL | 2 | 63.17 | SELL | |
| 3 | 63.57 | SELL | 3 | 63.40 | SELL | |
| 5 | 63.89 | SELL | 5 | 63.69 | SELL | |
| 8 | 63.77 | SELL | 8 | 64.08 | SELL | |
| 13 | 64.91 | SELL | 13 | 64.62 | SELL | |
| 21 | 65.88 | SELL | 21 | 65.08 | SELL | |
| 34 | 66.18 | SELL | 34 | 65.14 | SELL | |
| 55 | 64.64 | SELL | 55 | 64.76 | SELL | |
| 90 | 63.68 | SELL | 90 | 64.08 | SELL | |
| 200 | 63.04 | SELL | 200 | 62.55 | BUY |
Molson Coors Beverage Co - B
IPO: 1999-03-11
Ticker: TAPIndices: S&P 500,
Exchange: New York Stock Exchange, Inc. (US - USD)
Website: https://www.molsoncoors.com/
Phone:
Common Stock
Manufacturing (
Malt Beverages
Year | 2020 | 2019 | 2018 | 2017 | 2016 | 2015 | 2014 | 2013 | 2012 | 2011 | 2010 | 2009 | 2008 | 2007 | 2006 | |
|---|---|---|---|---|---|---|---|---|---|---|---|---|---|---|---|---|
| 1 | Assets + | 27,331 | 28,860 | 30,110 | 30,247 | 29,342 | 12,276 | 13,996 | 15,580 | 16,212 | 12,424 | 12,698 | 12,021 | 10,387 | 377 | 182 |
| 2 | Cash and Cash Equivalents + | 770 | 523 | 1,058 | 419 | 561 | 431 | 625 | 442 | 624 | 1,079 | 1,218 | 734 | 216 | 377 | 182 |
| 3 | Property + | 4,250 | 4,546 | 4,608 | 4,674 | 4,507 | 1,591 | 1,798 | 1,970 | 1,996 | 1,430 | 1,389 | 1,292 | 1,302 | 0 | 0 |
| 4 | Property + | 7,667 | 7,551 | 7,167 | 6,770 | 6,007 | 2,981 | 3,141 | 3,429 | 3,220 | 2,450 | 2,315 | 2,235 | 0 | 0 | 0 |
| 5 | Intangible Assets + | 13,556 | 13,656 | 13,776 | 14,296 | 14,032 | 4,746 | 5,756 | 6,825 | 7,235 | 4,586 | 4,655 | 4,535 | 3,923 | 0 | 0 |
| 6 | Finite-Lived Intangible Assets + | -1,206 | -995 | -810 | -662 | -404 | -342 | -360 | -514 | -497 | -443 | -407 | -357 | -275 | 0 | 0 |
| 7 | Liabilities and Equity + | 27,331 | 28,860 | 30,110 | 30,247 | 29,342 | 12,276 | 13,996 | 15,580 | 16,212 | 12,424 | 12,698 | 12,021 | 10,387 | 7,252 | 5,863 |
| 8 | Liabilities + | 14,710 | 15,187 | 16,374 | 16,812 | 17,720 | 5,213 | 6,110 | 6,916 | 8,221 | 4,734 | 4,855 | 4,928 | 4,347 | 0 | 0 |
| 9 | Debt and Lease Obligation + | 14 | 8 | 12 | 387 | 7 | 8 | 5 | 525 | 13 | 2 | 0 | 0 | 0 | 0 | 0 |
| 10 | Stockholders' Equity + | 12,621 | 13,673 | 13,736 | 13,435 | 11,622 | 7,063 | 7,886 | 8,664 | 7,992 | 7,690 | 7,843 | 7,093 | 6,039 | 7,252 | 5,863 |
| 11 | Stockholders' Equity Attributable to Parent + | 12,365 | 13,419 | 13,507 | 13,226 | 11,419 | 7,043 | 7,863 | 8,639 | 7,967 | 7,648 | 7,799 | 7,080 | 6,055 | 0 | 0 |
| 12 | Partners' Capital + | 6,544 | 7,617 | 7,693 | 7,206 | 6,119 | 4,496 | 4,440 | 4,233 | 3,900 | 3,690 | 3,242 | 2,735 | 2,185 | 0 | 0 |
| 13 | Partners' Capital + | 6,544 | 7,617 | 7,693 | 7,206 | 6,119 | 4,496 | 4,440 | 4,233 | 3,900 | 3,690 | 3,242 | 2,735 | 2,185 | 0 | 0 |
| 14 | Limited Liability Company (LLC) Members' Equity + | 5,376 | 6,455 | 6,543 | 6,346 | 4,573 | 2,801 | 3,542 | 4,388 | 3,828 | 3,560 | 3,413 | 2,756 | 1,814 | 0 | 0 |
| 15 | Limited Liability Company (LLC) Members' Equity + | 5,376 | 6,455 | 6,543 | 6,346 | 4,573 | 2,801 | 3,542 | 4,388 | 3,828 | 3,560 | 3,413 | 2,756 | 1,814 | 0 | 0 |
| 16 | Current Assets + | 2,419 | 2,184 | 2,766 | 2,190 | 2,170 | 1,259 | 1,579 | 1,538 | 1,748 | 2,118 | 2,221 | 1,763 | 1,107 | 0 | 0 |
| 17 | Current Receivables + | 8 | 9 | 8 | 6 | 685 | 442 | 567 | 31 | 52 | 59 | 67 | 53 | 40 | 0 | 0 |
| 18 | Inventory + | 664 | 616 | 592 | 592 | 593 | 179 | 202 | 205 | 214 | 207 | 195 | 236 | 192 | 0 | 0 |
| 19 | Current Prepaid Expense + | 0 | 0 | 0 | 41 | 36 | 11 | 16 | 14 | 24 | 22 | 13 | 14 | 0 | 0 | 0 |
| 20 | Current Disposal Group + | 0 | 0 | 0 | 0 | 0 | 0 | 0 | 0 | 0 | 0 | 1 | 10 | 2 | 0 | 0 |
| 21 | Long-Term Assets + | 7,795 | 9,134 | 9,376 | 9,500 | 8,632 | 2,200 | 2,396 | 2,679 | 2,650 | 1,619 | 1,627 | 1,591 | 1,501 | 0 | 0 |
| 22 | Long-term Investments and Receivables + | 0 | 0 | 0 | 0 | 0 | 20 | 22 | 24 | 26 | 33 | 43 | 49 | 52 | 0 | 0 |
| 23 | Long-Term Disposal Group + | 0 | 0 | 0 | 0 | 0 | 0 | 0 | 0 | 0 | 0 | 1 | 10 | 0 | 0 | 0 |
| 24 | Current Liabilities + | 3,910 | 3,696 | 4,301 | 3,399 | 3,158 | 1,217 | 2,325 | 2,142 | 2,599 | 1,277 | 1,334 | 1,581 | 986 | 0 | 0 |
| 25 | Long-Term Other Undisclosed Liabilities | 0 | 0 | 0 | 0 | 0 | 0 | 0 | 0 | 0 | 0 | 1,411 | 1,730 | 1,436 | 0 | 0 |
| 26 | Long-Term Liabilities + | 2,995 | 2,845 | 9,218 | 10,915 | 11,668 | 2,986 | 2,433 | 3,304 | 3,536 | 2,015 | 3,521 | 3,347 | 3,361 | 0 | 0 |
| 27 | Increase (Decrease) in Stockholders' Equity [Roll Forward] + | -471 | -471 | -471 | -471 | -471 | -471 | -321 | -321 | -321 | -321 | 0 | 0 | 0 | 0 | 0 |
| 28 | Treasury Stock Transactions + | -471 | -471 | -471 | -471 | -471 | -471 | -321 | -321 | -321 | -321 | 0 | 0 | 0 | 0 | 0 |
| 29 | Treasury Stock + | -471 | -471 | -471 | -471 | -471 | -471 | -321 | -321 | -321 | -321 | 0 | 0 | 0 | 0 | 0 |
| 30 | Current Other Assets + | 297 | 225 | 246 | 278 | 211 | 105 | 79 | 82 | 89 | 72 | 58 | 48 | 47 | 0 | 0 |
| 31 | Total Current Assets + | 2,419 | 2,184 | 2,766 | 2,190 | 2,170 | 1,259 | 1,579 | 1,538 | 1,748 | 2,118 | 2,221 | 1,763 | 1,107 | 0 | 0 |
| 32 | Operating Lease + | 136 | 154 | 0 | 0 | 0 | 0 | 0 | 0 | 0 | 0 | 0 | 0 | 0 | 0 | 0 |
| 33 | Finance Lease + | 196 | 227 | 0 | 0 | 0 | 0 | 0 | 0 | 0 | 0 | 0 | 0 | 0 | 0 | 0 |
| 34 | Goodwill + | 6,151 | 7,631 | 8,261 | 8,406 | 8,250 | 1,983 | 2,192 | 2,419 | 2,453 | 1,453 | 1,489 | 1,475 | 1,298 | 0 | 0 |
| 35 | Long-Term Other Assets + | 955 | 842 | 698 | 682 | 382 | 217 | 204 | 260 | 197 | 166 | 138 | 116 | 203 | 0 | 0 |
| 36 | Assets for Plan Benefits + | 1,448 | 1,276 | 1,115 | 1,094 | 0 | 0 | 0 | 0 | 0 | 0 | 0 | 0 | 0 | 0 | 0 |
| 37 | Total Assets + | 27,331 | 28,860 | 30,110 | 30,247 | 29,342 | 12,276 | 13,996 | 15,580 | 16,212 | 12,424 | 12,698 | 12,021 | 10,387 | 0 | 0 |
| 38 | Total Liabilities + | 14,710 | 15,187 | 16,374 | 16,812 | 17,720 | 5,213 | 6,110 | 6,916 | 8,221 | 4,734 | 4,855 | 4,928 | 4,347 | 0 | 0 |
| 39 | Stockholders' Equity Attributable to Noncontrolling Interest + | 256 | 254 | 228 | 209 | 203 | 20 | 23 | 25 | 25 | 42 | 44 | 13 | -16 | 0 | 0 |
| 40 | Total Stockholders' Equity + | 12,621 | 13,673 | 13,736 | 13,435 | 11,622 | 7,063 | 7,886 | 8,664 | 7,992 | 7,690 | 7,843 | 7,093 | 6,039 | 7,252 | 5,863 |
| 41 | Total Liabilities and Equity + | 27,331 | 28,860 | 30,110 | 30,247 | 29,342 | 12,276 | 13,996 | 15,580 | 16,212 | 12,424 | 12,698 | 12,021 | 10,387 | 0 | 0 |
Year | 2020 | 2019 | 2018 | 2017 | 2016 | 2015 | 2014 | 2013 | 2012 | 2011 | 2010 | 2009 | 2008 | 2007 | |
|---|---|---|---|---|---|---|---|---|---|---|---|---|---|---|---|
| 1 | 9,654 | 10,579 | 10,770 | 11,003 | 4,885 | 0 | 0 | 0 | 0 | 0 | 0 | 0 | 0 | 0 | |
| 2 | 11,724 | 13,009 | 13,338 | 13,472 | 6,597 | 0 | 0 | 0 | 0 | 0 | 0 | 0 | 0 | 0 | |
| 3 | 0 | -6,378 | -6,585 | -6,237 | -2,999 | 0 | 0 | 0 | 0 | 0 | 0 | 0 | 0 | 0 | |
| 4 | 0 | 4,201 | 4,185 | 4,786 | 1,882 | 1,404 | 1,653 | 1,660 | 1,564 | 1,467 | 1,442 | 1,306 | 1,934 | 2,488 | |
| 5 | 0 | 859 | 858 | 813 | 388 | 314 | 313 | 320 | 273 | 217 | 202 | 187 | 273 | 346 | |
| 6 | 0 | 709 | -250 | 28 | -2,524 | 347 | 324 | 200 | 81 | 12 | 21 | 33 | 134 | 112 | |
| 7 | 0 | 71 | 0 | 0 | 0 | 0 | 0 | 0 | 0 | 0 | 0 | 0 | 0 | 0 | |
| 8 | 0 | 2,728 | 2,803 | 3,032 | 1,597 | 1,052 | 1,164 | 1,194 | 1,126 | 1,019 | 1,012 | 901 | 1,333 | 1,734 | |
| 9 | 0 | 764 | 1,632 | 1,725 | 3,309 | 522 | 726 | 806 | 867 | 893 | 864 | 754 | 622 | 641 | |
| 10 | 0 | -45 | -134 | 142 | -28 | -20 | -8 | -8 | 7 | -4 | 44 | -9 | 0 | 0 | |
| 11 | 0 | 8 | 8 | 6 | 27 | 8 | 11 | 14 | 11 | 11 | 11 | 11 | 17 | 27 | |
| 12 | 0 | -15 | -12 | 0 | -30 | 1 | -6 | 19 | -90 | -11 | 44 | 49 | -8 | 18 | |
| 13 | 0 | -284 | -272 | -343 | -274 | -111 | -140 | -151 | -275 | -119 | -56 | -36 | -123 | -115 | |
| 14 | 0 | 272 | 304 | 339 | 262 | 116 | 145 | 184 | 196 | 119 | 110 | 97 | 119 | 0 | |
| 15 | 0 | 281 | 306 | 349 | 272 | 120 | 145 | 184 | 196 | 119 | 110 | 97 | 119 | 135 | |
| 16 | 0 | 0 | 0 | 0 | 0 | 0 | 0 | 0 | 0 | 0 | 0 | 0 | 12 | 24 | |
| 17 | 0 | 0 | 0 | 1,382 | 3,035 | 411 | 586 | 654 | 592 | 774 | 809 | 718 | 499 | 526 | |
| 18 | 0 | 0 | 0 | 0 | 3 | 4 | -2 | 19 | 16 | 23 | 18 | 7 | 24 | 7 | |
| 19 | 0 | 480 | 1,360 | 1,382 | 3,035 | 411 | 586 | 654 | 592 | 0 | 0 | 0 | 0 | 0 | |
| 20 | 0 | -234 | -225 | 53 | -1,051 | -52 | -69 | -84 | -154 | -99 | -139 | 15 | -96 | -1 | |
| 21 | 0 | 12 | 910 | 1,488 | 934 | 307 | 448 | 486 | 284 | 576 | 531 | 747 | 307 | 524 | |
| 22 | 0 | 0 | 0 | 0 | 0 | 0 | 0 | 0 | 4 | 3 | -2 | -9 | -12 | 0 | |
| 23 | 0 | 0 | 0 | 0 | 0 | 0 | 0 | 0 | 0 | 0 | 43 | 0 | 0 | 0 | |
| 24 | 0 | 246 | 1,135 | 1,436 | 1,982 | 363 | 518 | 572 | 439 | 677 | 710 | 723 | 391 | 507 | |
| 25 | 0 | -4 | -18 | -22 | -6 | -3 | -4 | -5 | 4 | -1 | -2 | -3 | -12 | -15 | |
| 26 | Total Net Income (Loss) Attributable to Parent + | 0 | 242 | 1,116 | 1,414 | 1,976 | 360 | 514 | 567 | 443 | 676 | 708 | 720 | 379 | 492 |
| 27 | Income (Loss) from Continuing Operations + | 0 | 246 | 1,135 | 1,435 | 1,985 | 359 | 517 | 570 | 438 | 675 | 670 | 732 | 403 | 525 |
| 28 | Total Income (Loss) from Continuing Operations + | 0 | 0 | 0 | 2,848 | 3,964 | 715 | 1,031 | 1,135 | 880 | 1,349 | 1,338 | 1,461 | 794 | 1,035 |
| 29 | Income (Loss) from Discontinued Operations + | 0 | 0 | 0 | 0 | 0 | 0 | 0 | 0 | 0 | 0 | 43 | 0 | 0 | 0 |
| 30 | Total Income (Loss) from Discontinued Operations + | 0 | 0 | 0 | 2 | -3 | 4 | 0 | 2 | 2 | 2 | 40 | -9 | -12 | -18 |
| 31 | Income (Loss) from Continuing Operations + | 0 | 1.12 | 5.17 | 6.56 | 9.33 | 1.92 | 2.78 | 3.09 | 2.44 | 3.65 | 3.59 | 3.96 | 2.14 | 2.85 |
| 32 | 0 | 0 | 0 | 0.01 | -0.01 | 0.02 | 0 | 0.01 | 0.01 | 0.01 | 0.21 | -0.05 | -0.07 | -0.10 | |
| 33 | Total Earnings Per Share + | 0 | 0 | 0 | 6.57 | 9.32 | 1.94 | 2.78 | 3.10 | 2.45 | 3.66 | 3.80 | 3.91 | 2.07 | 2.75 |
| 34 | Income (Loss) from Continuing Operations + | 0 | 1.12 | 5.17 | 6.56 | 9.33 | 1.92 | 2.78 | 3.09 | 2.44 | 3.65 | 3.59 | 3.96 | 2.14 | 2.85 |
| 35 | Income (Loss) from Continuing Operations + | 0 | 1.11 | 5.15 | 6.52 | 9.27 | 1.91 | 2.76 | 3.07 | 2.43 | 3.62 | 3.57 | 3.92 | 2.11 | 2.81 |
| 36 | 0 | 0 | 0 | 0.01 | -0.01 | 0.02 | 0 | 0.01 | 0.01 | 0.01 | 0.21 | -0.05 | -0.07 | -0.10 | |
| 37 | Total Earnings Per Share + | 0 | 0 | 0 | 6.53 | 9.26 | 1.93 | 2.76 | 3.08 | 2.44 | 3.63 | 3.78 | 3.87 | 2.04 | 2.71 |
| 38 | 0 | 1.96 | 1.64 | 1.64 | 1.64 | 1.64 | 1.48 | 1.28 | 1.28 | 1.24 | 1.08 | 0.92 | 0.76 | 0 | |
| 39 | 0 | 0 | 0 | 0 | 0 | 0 | 0 | 0 | 0 | 2.48 | 2.16 | 1.84 | 1.52 | 0 |

 Click to Enlarge