| Date | Price $ | Result % | Candle Name | Side |
|---|---|---|---|---|
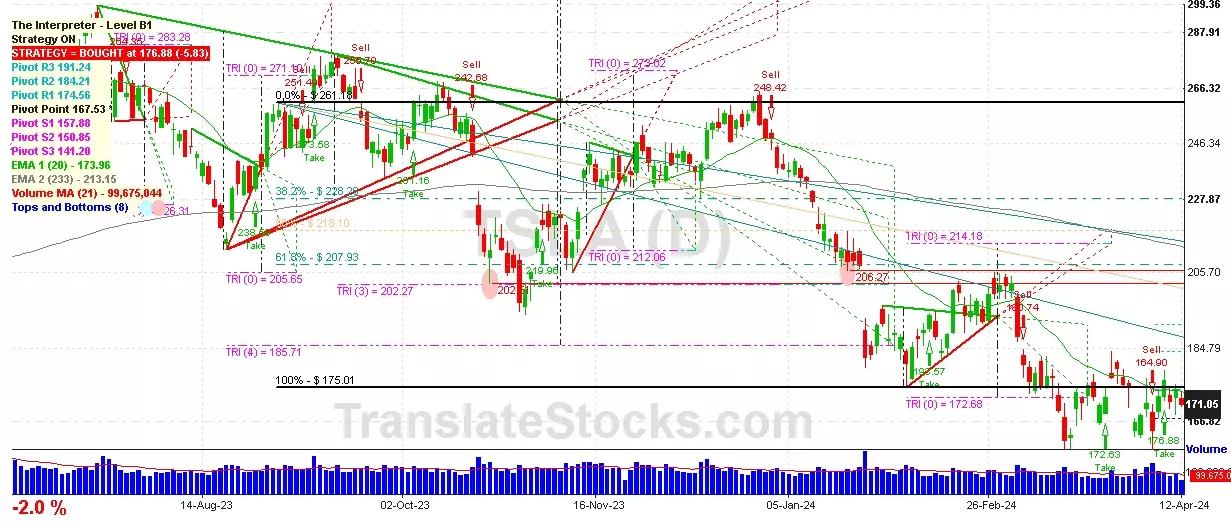
| 001 21 Mar 2024 | Sell Price: 172.82 | Profit: Open Day1 ($ 166.69) | Engulfing | Sell |
| 002 21 Mar 2024 | Sell Price: 173.04 | Profit: Open Day1 ($ 166.69) | Dark Cloud Cover | Sell |
| 003 16 Jan 2024 | Buy Price: 219.91 | Loss: Close Day2 ($ 211.88) | Piercing Line | Buy |
| 004 13 Dec 2023 | Buy Price: 239.29 | Profit: Open Day1 ($ 241.22) | Engulfing | Buy |
| 005 13 Dec 2023 | Buy Price: 238.33 | Profit: Open Day1 ($ 241.22) | Piercing Line | Buy |
| 006 16 Jun 2023 | Buy Price: 260.54 | Profit: Open Day1 ($ 261.50) | Abandoned Baby | Buy |
| 007One Year Average | Both Sides Result for 6 Signals |
Profit: $ 10.23 ($ 1.70 / Signal) |
All of Them | Buy + Sell |
| Simple Moving Averages (SMA) Period | Value $ | Signal | Exponential Moving Averages (EMA) Period | Value $ | Signal | |
|---|---|---|---|---|---|---|
| 2 | 166.16 | BUY | 2 | 165.54 | BUY | |
| 3 | 159.00 | BUY | 3 | 162.00 | BUY | |
| 5 | 153.22 | BUY | 5 | 158.68 | BUY | |
| 8 | 153.57 | BUY | 8 | 158.00 | BUY | |
| 13 | 160.33 | BUY | 13 | 159.66 | BUY | |
| 21 | 164.72 | BUY | 21 | 163.07 | BUY | |
| 34 | 167.65 | BUY | 34 | 168.51 | BUY | |
| 55 | 177.09 | SELL | 55 | 176.97 | SELL | |
| 90 | 195.09 | SELL | 90 | 188.61 | SELL | |
| 200 | 222.62 | SELL | 200 | 214.32 | SELL |
Tesla Inc
IPO: 2010-06-29
Ticker: TSLAIndices: S&P 500,
Nasdaq 100,
Exchange: Nasdaq Nms - Global Market (US - USD)
Website: https://www.tesla.com/
Phone:
Common Stock
Manufacturing (
Motor Vehicles & Passenger Car Bodies
Year | 2020 | 2019 | 2018 | 2017 | 2016 | 2015 | 2014 | 2013 | 2012 | 2011 | 2010 | 2009 | 2008 | |
|---|---|---|---|---|---|---|---|---|---|---|---|---|---|---|
| 1 | Assets + | 52,148 | 34,309 | 29,740 | 28,655 | 22,664 | 8,092 | 5,849 | 2,417 | 1,114 | 713 | 386 | 70 | 9 |
| 2 | Cash and Cash Equivalents + | 19,384 | 6,268 | 3,686 | 3,368 | 3,393 | 1,197 | 1,906 | 846 | 202 | 255 | 100 | 70 | 9 |
| 3 | Property + | 12,747 | 10,396 | 11,330 | 10,028 | 5,983 | 3,403 | 1,829 | 738 | 552 | 298 | 115 | 0 | 0 |
| 4 | Property + | 17,864 | 14,130 | 14,029 | 11,751 | 6,980 | 3,974 | 2,122 | 879 | 610 | 331 | 0 | 0 | 0 |
| 5 | Intangible Assets + | 313 | 339 | 282 | 362 | 376 | 13 | 0 | 0 | 0 | 0 | 0 | 0 | 0 |
| 6 | Finite-Lived Intangible Assets + | 298 | 334 | 235 | 275 | 289 | 0 | 0 | 0 | 0 | 0 | 0 | 0 | 0 |
| 7 | Liabilities and Equity + | 52,148 | 34,309 | 29,740 | 28,655 | 22,664 | 8,092 | 5,849 | 2,417 | 1,114 | 713 | 386 | -254 | -200 |
| 8 | Liabilities + | 28,418 | 26,199 | 23,426 | 23,023 | 16,750 | 6,961 | 4,879 | 1,750 | 989 | 489 | 179 | 0 | 0 |
| 9 | Temporary Equity + | 655 | 643 | 556 | 398 | 376 | 0 | 0 | 0 | 0 | 0 | 0 | 0 | 0 |
| 10 | Redeemable Noncontrolling Interest + | 604 | 643 | 556 | 398 | 367 | 0 | 0 | 0 | 0 | 0 | 0 | 0 | 0 |
| 11 | Temporary Equity + | 51 | 0 | 0 | 0 | 9 | 0 | 0 | 0 | 0 | 0 | 0 | 0 | 0 |
| 12 | Stockholders' Equity + | 23,075 | 7,467 | 5,758 | 5,235 | 5,905 | 1,084 | 912 | 667 | 125 | 224 | 207 | -254 | -200 |
| 13 | Stockholders' Equity Attributable to Parent + | 22,225 | 6,618 | 4,923 | 4,237 | 4,753 | 1,089 | 912 | 667 | 125 | 224 | 207 | -254 | -200 |
| 14 | Preferred Stock + | 0 | 0 | 0 | 0 | 0 | 0 | 0 | 0 | 0 | 0 | 0 | 0 | 0 |
| 15 | Common Stock + | 0 | 0 | 0 | 0 | 0 | 0 | 0 | 0 | 0 | 0 | 0 | 0 | 0 |
| 16 | Partners' Capital + | -5,399 | -6,083 | -5,318 | -4,974 | -2,997 | -2,322 | -1,434 | -1,140 | -1,066 | -669 | -415 | 0 | 0 |
| 17 | Partners' Capital + | -5,399 | -6,083 | -5,318 | -4,974 | -2,997 | -2,322 | -1,434 | -1,140 | -1,066 | -669 | -415 | 0 | 0 |
| 18 | Limited Liability Company (LLC) Members' Equity + | -5,036 | -6,119 | -5,326 | -4,941 | -3,021 | -2,326 | -1,434 | -1,140 | -1,066 | -669 | -415 | 0 | 0 |
| 19 | Limited Liability Company (LLC) Members' Equity + | -5,036 | -6,119 | -5,326 | -4,941 | -3,021 | -2,326 | -1,434 | -1,140 | -1,066 | -669 | -415 | 0 | 0 |
| 20 | Current Assets + | 26,717 | 12,103 | 8,306 | 6,571 | 6,260 | 2,792 | 3,199 | 1,266 | 525 | 373 | 236 | 0 | 0 |
| 21 | Cash + | 238 | 246 | 193 | 155 | 212 | 40 | 18 | 3 | 19 | 48 | 74 | 0 | 0 |
| 22 | Current Receivables + | 1,895 | 1,333 | 949 | 515 | 499 | 169 | 227 | 49 | 27 | 10 | 7 | 0 | 0 |
| 23 | Inventory + | 4,101 | 3,552 | 3,113 | 2,264 | 2,067 | 1,278 | 954 | 340 | 269 | 50 | 45 | 0 | 0 |
| 24 | Long-Term Assets + | 4,795 | 3,854 | 640 | 333 | 217 | 75 | 43 | 24 | 22 | 22 | 23 | 0 | 0 |
| 25 | Long-term Investments and Receivables + | 0 | 393 | 422 | 457 | 506 | 0 | 0 | 0 | 0 | 0 | 0 | 0 | 0 |
| 26 | Long-Term Restricted Cash and Investments + | 279 | 269 | 398 | 442 | 268 | 32 | 11 | 6 | 5 | 8 | 5 | 0 | 0 |
| 27 | Current Liabilities + | 14,248 | 10,667 | 9,992 | 7,675 | 5,827 | 2,816 | 2,107 | 675 | 539 | 191 | 86 | 0 | 0 |
| 28 | Long-Term Other Undisclosed Liabilities | 8,492 | 10,689 | 1,261 | 3,442 | 3,135 | 1,723 | 776 | 418 | 0 | 0 | 9 | 0 | 0 |
| 29 | Long-Term Liabilities + | 14,170 | 15,532 | 13,434 | 15,348 | 10,923 | 4,145 | 2,772 | 1,075 | 437 | 292 | 93 | 0 | 0 |
| 30 | Total Current Assets + | 26,717 | 12,103 | 8,306 | 6,571 | 6,260 | 2,792 | 3,199 | 1,266 | 525 | 373 | 236 | 0 | 0 |
| 31 | Operating Lease + | 1,558 | 1,218 | 0 | 0 | 0 | 0 | 0 | 0 | 0 | 0 | 0 | 0 | 0 |
| 32 | Finance Lease + | 3,052 | 2,848 | 0 | 0 | 0 | 0 | 0 | 0 | 0 | 0 | 0 | 0 | 0 |
| 33 | Goodwill + | 207 | 198 | 68 | 60 | 0 | 0 | 0 | 0 | 0 | 0 | 0 | 0 | 0 |
| 34 | Long-Term Other Assets + | 1,536 | 808 | 572 | 273 | 217 | 75 | 43 | 24 | 22 | 22 | 23 | 0 | 0 |
| 35 | Long-Term Regulated Entity + | 0 | 0 | 0 | 0 | 0 | 0 | 0 | 0 | 6 | 6 | 0 | 0 | 0 |
| 36 | Total Assets + | 52,148 | 34,309 | 29,740 | 28,655 | 22,664 | 8,092 | 5,849 | 2,417 | 1,114 | 713 | 386 | 0 | 0 |
| 37 | Total Liabilities + | 28,418 | 26,199 | 23,426 | 23,023 | 16,750 | 6,961 | 4,879 | 1,750 | 989 | 489 | 179 | 0 | 0 |
| 38 | Stockholders' Equity Attributable to Noncontrolling Interest + | 850 | 849 | 834 | 997 | 785 | 0 | 0 | 0 | 0 | 0 | 0 | 0 | 0 |
| 39 | Total Stockholders' Equity + | 23,075 | 7,467 | 5,758 | 5,235 | 5,905 | 1,084 | 912 | 0 | 0 | 0 | 0 | 0 | 0 |
| 40 | Total Liabilities and Equity + | 52,148 | 34,309 | 29,740 | 28,655 | 22,664 | 8,092 | 5,849 | 2,417 | 1,114 | 713 | 386 | 0 | 0 |
Year | 2020 | 2019 | 2018 | 2017 | 2016 | 2015 | 2014 | 2013 | 2012 | 2011 | 2010 | 2009 | |
|---|---|---|---|---|---|---|---|---|---|---|---|---|---|
| 1 | 120 | 0 | 0 | 0 | 0 | 0 | 0 | 0 | 0 | 0 | 0 | 0 | |
| 2 | 31,536 | 24,578 | 21,461 | 11,759 | 7,000 | 4,046 | 3,198 | 2,013 | 413 | 204 | 117 | 112 | |
| 3 | -24,906 | -20,509 | -17,419 | -9,536 | -5,401 | -3,123 | -2,317 | -1,557 | -383 | -143 | -86 | -102 | |
| 4 | 6,630 | 4,069 | 4,042 | 2,222 | 1,599 | 924 | 882 | 456 | 30 | 62 | 31 | 10 | |
| 5 | 1,491 | 1,343 | 1,460 | 1,378 | 834 | 718 | 465 | 232 | 274 | 209 | 93 | 19 | |
| 6 | 0 | 0 | 0 | 1,636 | 947 | 423 | 232 | 106 | 29 | 17 | 11 | 7 | |
| 7 | 0 | 0 | 0 | 36 | 19 | 10 | 7 | 0 | 0 | 0 | 0 | 0 | |
| 8 | 451 | 426 | 0 | 0 | 0 | 0 | 0 | 0 | 0 | 0 | 0 | 0 | |
| 9 | 3,145 | 2,646 | 2,834 | 2,476 | 1,432 | 922 | 604 | 286 | 150 | 104 | 85 | 42 | |
| 10 | -117 | -146 | -161 | -106 | -35 | -38 | -14 | 0 | 0 | 0 | 0 | 0 | |
| 11 | 0 | 37 | 0 | 0 | 0 | 38 | 14 | 2 | 0 | 0 | 0 | 0 | |
| 12 | -4,636 | -4,138 | -4,430 | -3,855 | -2,267 | -1,640 | -1,068 | -518 | -424 | -313 | -178 | -61 | |
| 13 | 1,994 | -69 | -388 | -1,632 | -667 | -717 | -187 | -61 | -394 | -251 | -147 | -52 | |
| 14 | 30 | 44 | 25 | 20 | 9 | 2 | 1 | 0 | 0 | 0 | 0 | 0 | |
| 15 | 0 | 0 | 2 | -52 | 29 | -56 | 2 | -4 | 0 | 0 | 0 | 0 | |
| 16 | -122 | 45 | 22 | -125 | 111 | -42 | 2 | 23 | -2 | -3 | -7 | -1 | |
| 17 | 358 | 220 | 173 | 160 | 135 | 138 | 111 | 1 | 0 | 0 | 0 | 0 | |
| 18 | 0 | 0 | 0 | 0 | 0 | 0 | 0 | 0 | 1 | 1 | 1 | 0 | |
| 19 | 458 | 324 | 0 | 0 | 0 | 0 | 0 | 0 | 0 | 0 | 0 | 0 | |
| 20 | 748 | 685 | 663 | 471 | 199 | 119 | 101 | 33 | 0 | 0 | 1 | 3 | |
| 21 | 105 | 0 | 0 | 0 | 0 | 0 | 0 | 0 | 0 | 0 | 0 | 0 | |
| 22 | 1,154 | -665 | -1,005 | -2,209 | -746 | -876 | -285 | -71 | -396 | -254 | -154 | -56 | |
| 23 | -292 | -110 | -58 | -32 | -27 | -13 | -9 | -3 | 0 | 0 | 0 | 0 | |
| 24 | 862 | -775 | -1,063 | -2,241 | -773 | -889 | -294 | 0 | 0 | 0 | 0 | 0 | |
| 25 | -141 | -87 | 86 | 279 | 98 | 0 | 0 | 0 | 0 | 0 | 0 | 0 | |
| 26 | Total Net Income (Loss) Attributable to Parent + | 721 | -862 | -976 | -1,961 | -675 | -889 | -294 | -74 | -396 | -254 | -154 | -56 |
| 27 | 690 | -870 | -976 | -1,961 | -675 | -889 | -294 | 0 | 0 | 0 | 0 | 0 | |
| 28 | Income (Loss) from Continuing Operations + | 0.28 | 0.58 | 0.81 | -4.01 | -0.78 | -2.44 | -0.86 | -0.13 | 0 | 0 | 0 | 0 |
| 29 | Total Earnings Per Share + | 0.74 | -4.92 | -5.72 | -11.83 | -4.68 | -6.93 | 0 | 0 | 0 | 0 | 0 | 0 |
| 30 | Income (Loss) from Continuing Operations + | 0.28 | 0.58 | 0.81 | -4.01 | -0.78 | -2.44 | -0.86 | -0.13 | 0 | 0 | 0 | 0 |
| 31 | Income (Loss) from Continuing Operations + | 0.24 | 0.56 | 0.78 | -4.01 | -0.78 | -2.44 | -0.86 | -0.13 | 0 | 0 | 0 | 0 |
| 32 | Total Earnings Per Share + | 0.64 | -4.92 | -5.72 | -11.83 | -4.68 | -6.93 | 0 | 0 | 0 | 0 | 0 | 0 |
| 33 | Income (Loss) from Continuing Operations + | 0 | 0 | 0 | 0 | 0 | 0 | 0 | -0.62 | -3.69 | -2.53 | -3.04 | -7.94 |
| 34 | Total Earnings Per Share + | 0 | 0 | 0 | 0 | -4.68 | -6.93 | -2.36 | -0.62 | -3.69 | 0 | 0 | 0 |

 Click to Enlarge