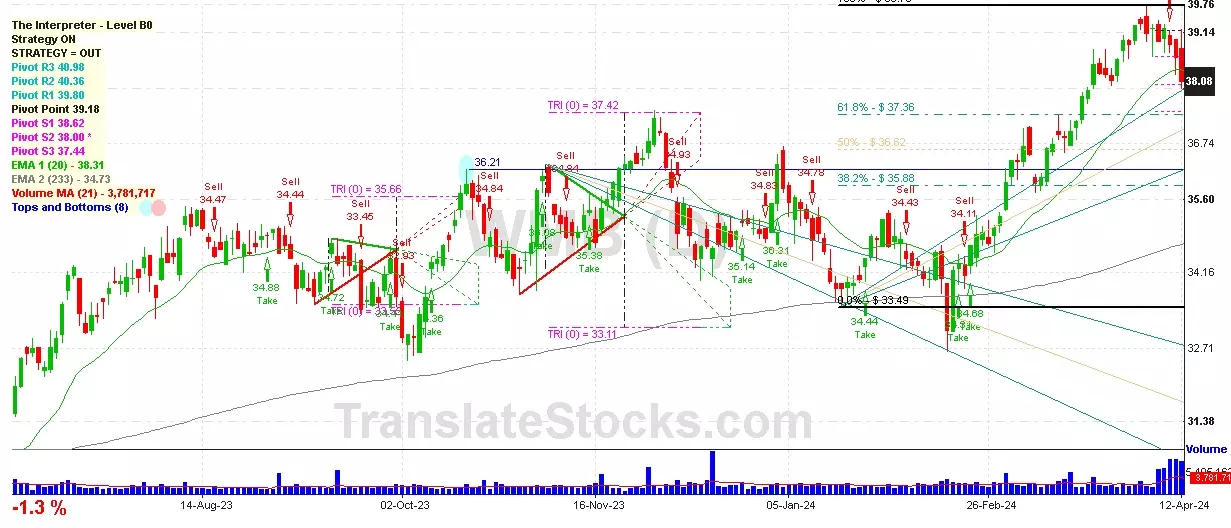
Hey Friend, I'm analysing WILLIAMS COS INC (WMB), and it is between the Support of $ 38.00 (PivotS2) and the Resistance of $ 38.62 (PivotS1). The stock is also approaching the line of PivotS2 at $ 38.00, and if it goes below this line it could reach the next Support of Triangle projection at $37.42.

| Date | Price $ | Result % | Candle Name | Side |
|---|---|---|---|---|
| 001 15 Mar 2024 | Buy Price: 37.00 | Profit: Open Day1 ($ 37.09) | Engulfing | Buy |
| 002 14 Mar 2024 | Sell Price: 36.88 | Profit: Open Day1 ($ 36.71) | Abandoned Baby | Sell |
| 003 15 Feb 2024 | Buy Price: 34.19 | Profit: Open Day1 ($ 34.24) | Engulfing | Buy |
| 004 18 Oct 2023 | Sell Price: 35.65 | Profit: Close Day1 ($ 35.57) | Engulfing | Sell |
| 005 29 Sep 2023 | Sell Price: 33.69 | Profit: Open Day1 ($ 33.54) | Engulfing | Sell |
| 006 22 Aug 2023 | Sell Price: 34.63 | Profit: Open Day1 ($ 34.48) | Engulfing | Sell |
| 007 05 Jul 2023 | Sell Price: 32.46 | Profit: Open Day1 ($ 32.32) | Engulfing | Sell |
| 008One Year Average | Both Sides Result for 7 Signals |
Profit: $ 0.83 ($ 0.12 / Signal) |
All of Them | Buy + Sell |
| Simple Moving Averages (SMA) Period | Value $ | Signal | Exponential Moving Averages (EMA) Period | Value $ | Signal | |
|---|---|---|---|---|---|---|
| 2 | 39.35 | BUY | 2 | 39.32 | BUY | |
| 3 | 39.16 | BUY | 3 | 39.18 | BUY | |
| 5 | 38.93 | BUY | 5 | 38.95 | BUY | |
| 8 | 38.45 | BUY | 8 | 38.77 | BUY | |
| 13 | 38.48 | BUY | 13 | 38.63 | BUY | |
| 21 | 38.69 | BUY | 21 | 38.42 | BUY | |
| 34 | 38.19 | BUY | 34 | 38.00 | BUY | |
| 55 | 36.96 | BUY | 55 | 37.40 | BUY | |
| 90 | 36.13 | BUY | 90 | 36.69 | BUY | |
| 200 | 35.33 | BUY | 200 | 35.32 | BUY |
Williams Cos Inc
IPO: 1967-12-04
Ticker: WMBIndices: S&P 500,
Exchange: New York Stock Exchange, Inc. (US - USD)
Website: https://www.williams.com/
Phone:
Common Stock
Energy & Transportation (
Natural Gas Transmission
 Click to Enlarge