| Date | Price $ | Result % | Candle Name | Side |
|---|---|---|---|---|
| 001 15 Mar 2024 | Buy Price: 13.45 | Profit: Close Day1 ($ 13.55) | Abandoned Baby | Buy |
| 002 15 Mar 2024 | Buy Price: 13.48 | Profit: Close Day1 ($ 13.55) | Engulfing | Buy |
| 003 12 Oct 2023 | Sell Price: 13.09 | Loss: Close Day2 ($ 13.21) | Engulfing | Sell |
| 004 15 Jun 2023 | Sell Price: 11.63 | Profit: Open Day1 ($ 11.61) | Abandoned Baby | Sell |
| 005 13 Jun 2023 | Buy Price: 11.80 | Profit: Open Day1 ($ 11.81) | Abandoned Baby | Buy |
| 006 08 Jun 2023 | Sell Price: 11.78 | Profit: Open Day1 ($ 11.77) | Engulfing | Sell |
| 007 06 Jun 2023 | Buy Price: 11.83 | Profit: Open Day1 ($ 11.90) | Engulfing | Buy |
| 008 19 May 2023 | Sell Price: 12.22 | Profit: Close Day2 ($ 12.11) | Engulfing | Sell |
| 009One Year Average | Both Sides Result for 8 Signals |
Profit: $ 0.27 ($ 0.03 / Signal) |
All of Them | Buy + Sell |
| Simple Moving Averages (SMA) Period | Value $ | Signal | Exponential Moving Averages (EMA) Period | Value $ | Signal | |
|---|---|---|---|---|---|---|
| 2 | 13.50 | BUY | 2 | 13.50 | BUY | |
| 3 | 13.43 | BUY | 3 | 13.43 | BUY | |
| 5 | 13.25 | BUY | 5 | 13.32 | BUY | |
| 8 | 13.07 | BUY | 8 | 13.26 | BUY | |
| 13 | 13.19 | BUY | 13 | 13.27 | BUY | |
| 21 | 13.38 | BUY | 21 | 13.31 | BUY | |
| 34 | 13.51 | BUY | 34 | 13.31 | BUY | |
| 55 | 13.29 | BUY | 55 | 13.20 | BUY | |
| 90 | 12.85 | BUY | 90 | 13.00 | BUY | |
| 200 | 12.54 | BUY | 200 | 12.79 | BUY |
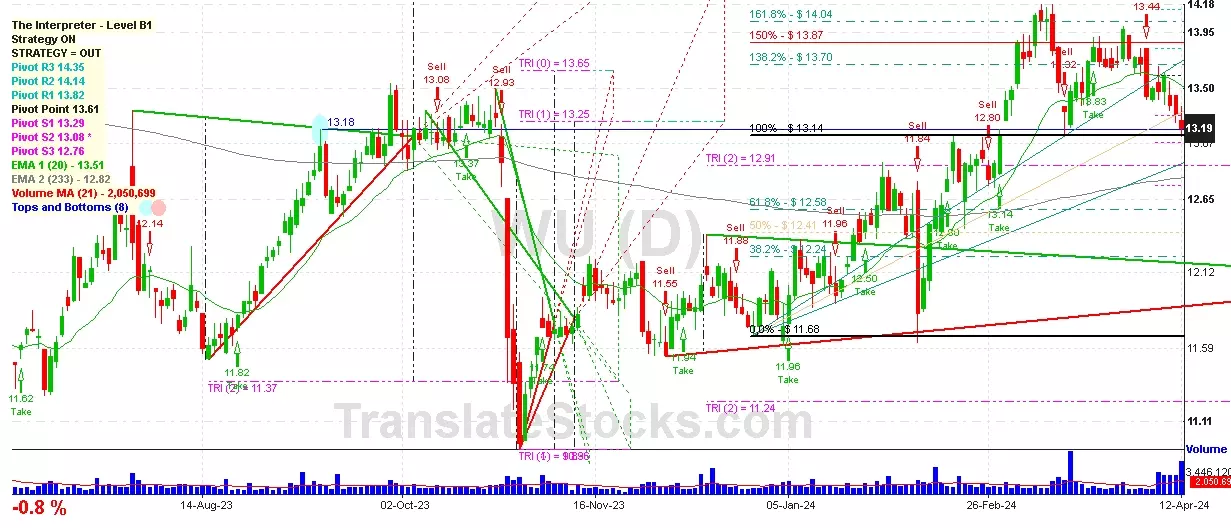
Western Union Co
IPO: 2006-09-20
Ticker: WUIndices: S&P 500,
Exchange: New York Stock Exchange, Inc. (US - USD)
Website: https://corporate.westernunion.com/
Phone:
Common Stock
Trade & Services (
Services-business Services, Nec

 Click to Enlarge