| Date | Price $ | Result % | Candle Name | Side |
|---|---|---|---|---|
| 001 30 Apr 2024 | Buy Price: 234.69 | Profit: Close Day1 ($ 238.80) | Abandoned Baby | Buy |
| 002 05 Mar 2024 | Buy Price: 245.35 | Profit: Close Day1 ($ 248.62) | Engulfing | Buy |
| 003 28 Feb 2024 | Buy Price: 245.47 | Loss: Close Day2 ($ 243.69) | Abandoned Baby | Buy |
| 004 12 Feb 2024 | Sell Price: 235.62 | Loss: Close Day2 ($ 238.75) | Engulfing | Sell |
| 005 10 Jan 2024 | Buy Price: 230.15 | Profit: Open Day1 ($ 230.72) | Engulfing | Buy |
| 006 13 Dec 2023 | Sell Price: 244.91 | Profit: Open Day1 ($ 243.42) | Engulfing | Sell |
| 007 13 Dec 2023 | Sell Price: 245.21 | Profit: Open Day1 ($ 243.42) | Dark Cloud Cover | Sell |
| 008 30 Nov 2023 | Buy Price: 249.00 | Loss: Close Day2 ($ 247.55) | Engulfing | Buy |
| 009 31 Aug 2023 | Sell Price: 230.48 | Profit: Close Day2 ($ 226.80) | Abandoned Baby | Sell |
| 010 20 Jun 2023 | Sell Price: 211.64 | Profit: Open Day1 ($ 211.22) | Abandoned Baby | Sell |
| 011One Year Average | Both Sides Result for 10 Signals |
Profit: $ 8.97 ($ 0.90 / Signal) |
All of Them | Buy + Sell |
| Simple Moving Averages (SMA) Period | Value $ | Signal | Exponential Moving Averages (EMA) Period | Value $ | Signal | |
|---|---|---|---|---|---|---|
| 2 | 238.70 | SELL | 2 | 238.12 | BUY | |
| 3 | 237.36 | BUY | 3 | 237.58 | BUY | |
| 5 | 235.95 | BUY | 5 | 236.95 | BUY | |
| 8 | 236.42 | BUY | 8 | 236.60 | BUY | |
| 13 | 235.49 | BUY | 13 | 236.85 | BUY | |
| 21 | 237.09 | BUY | 21 | 238.01 | BUY | |
| 34 | 241.76 | SELL | 34 | 239.47 | SELL | |
| 55 | 243.39 | SELL | 55 | 240.15 | SELL | |
| 90 | 238.85 | SELL | 90 | 239.39 | SELL | |
| 200 | 235.17 | BUY | 200 | 232.46 | BUY |
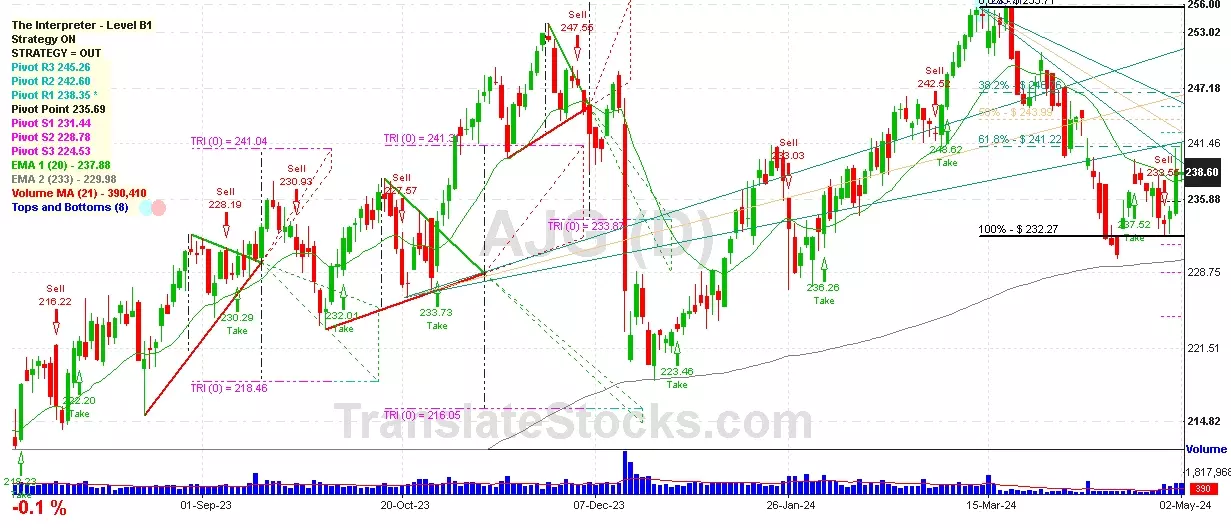
Arthur J Gallagher & Co
IPO: 1984-06-21
Ticker: AJGIndices: S&P 500,
Exchange: New York Stock Exchange, Inc. (US - USD)
Website: https://www.ajg.com/
Phone:
Common Stock
Finance (
Insurance Agents, Brokers & Service

 Click to Enlarge