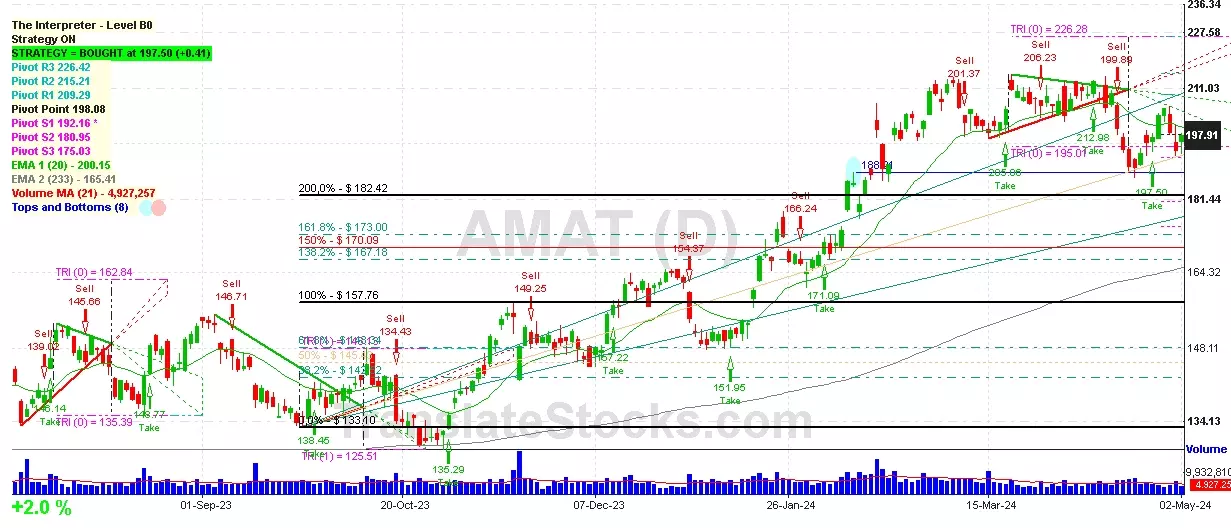
Hey Friend, I'm analysing APPLIED MATERIALS INC (AMAT), and it is between the Support of $ 195.01 (Triangle Projection Level 0) and the Resistance of $ 198.08 (Pivot). The stock is also approaching the line of Pivot at $ 198.08, and if it goes above this line it could reach the next Resistance of Triangle projection at $226.28.

| Date | Price $ | Result % | Candle Name | Side |
|---|---|---|---|---|
| 001 11 Apr 2024 | Buy Price: 212.98 | Loss: Close Day2 ($ 205.68) | Abandoned Baby | Buy |
| 002 03 Apr 2024 | Buy Price: 207.38 | Profit: Open Day1 ($ 211.61) | Engulfing | Buy |
| 003 22 Mar 2024 | Sell Price: 210.25 | Profit: Open Day1 ($ 207.63) | Abandoned Baby | Sell |
| 004 12 Mar 2024 | Buy Price: 204.94 | Loss: Close Day2 ($ 200.75) | Abandoned Baby | Buy |
| 005 08 Mar 2024 | Sell Price: 205.56 | Profit: Open Day1 ($ 203.28) | Abandoned Baby | Sell |
| 006 20 Feb 2024 | Sell Price: 189.14 | Profit: Open Day1 ($ 187.92) | Abandoned Baby | Sell |
| 007 20 Nov 2023 | Buy Price: 152.57 | Loss: Close Day2 ($ 149.48) | Abandoned Baby | Buy |
| 008 16 Nov 2023 | Sell Price: 154.81 | Profit: Open Day1 ($ 142.04) | Engulfing | Sell |
| 009 09 Nov 2023 | Sell Price: 143.17 | Loss: Close Day2 ($ 149.74) | Dark Cloud Cover | Sell |
| 010 17 Oct 2023 | Buy Price: 142.72 | Profit: Open Day2 ($ 142.84) | Engulfing | Buy |
| 011 05 Sep 2023 | Sell Price: 153.61 | Profit: Open Day1 ($ 153.25) | Abandoned Baby | Sell |
| 012 16 Jun 2023 | Sell Price: 138.93 | Profit: Close Day1 ($ 138.52) | Dark Cloud Cover | Sell |
| 013 31 May 2023 | Sell Price: 133.30 | Loss: Close Day2 ($ 134.63) | Abandoned Baby | Sell |
| 014One Year Average | Both Sides Result for 13 Signals |
Profit: $ 1.53 ($ 0.12 / Signal) |
All of Them | Buy + Sell |
| Simple Moving Averages (SMA) Period | Value $ | Signal | Exponential Moving Averages (EMA) Period | Value $ | Signal | |
|---|---|---|---|---|---|---|
| 2 | 195.95 | BUY | 2 | 197.31 | BUY | |
| 3 | 196.85 | BUY | 3 | 197.59 | BUY | |
| 5 | 199.84 | SELL | 5 | 197.96 | SELL | |
| 8 | 198.25 | SELL | 8 | 198.29 | SELL | |
| 13 | 197.61 | BUY | 13 | 199.13 | SELL | |
| 21 | 201.68 | SELL | 21 | 200.24 | SELL | |
| 34 | 203.35 | SELL | 34 | 200.11 | SELL | |
| 55 | 202.44 | SELL | 55 | 196.63 | BUY | |
| 90 | 187.38 | BUY | 90 | 188.80 | BUY | |
| 200 | 163.89 | BUY | 200 | 169.42 | BUY |
Applied Materials Inc
IPO: 1972-10-05
Ticker: AMATIndices: S&P 500,
Nasdaq 100,
Exchange: Nasdaq Nms - Global Market (US - USD)
Website: https://www.appliedmaterials.com/
Phone:
Common Stock
Manufacturing (
Semiconductors & Related Devices
 Click to Enlarge