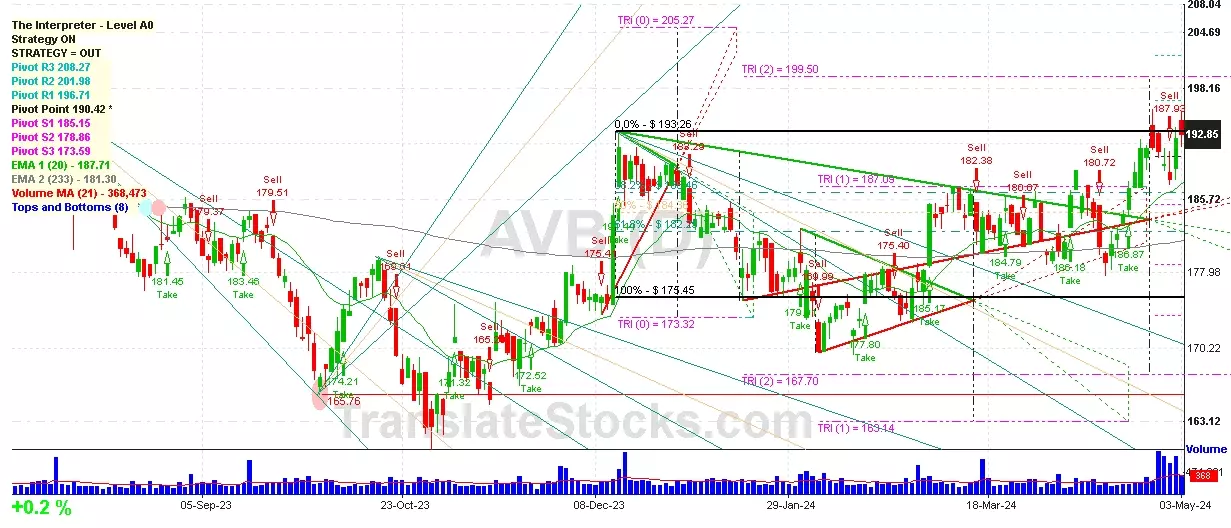
Hey Friend, I'm analysing AVALONBAY COMMUNITIES INC (AVB), and it is between the Support of $ 190.42 (Pivot) and the Resistance of $ 193.26 (0% of Fibonacci). The stock is also approaching the line of Pivot at $ 190.42, and if it goes below this line it could reach the next Support of Triangle projection at $187.09.

| Date | Price $ | Result % | Candle Name | Side |
|---|---|---|---|---|
| 001 03 Apr 2024 | Buy Price: 180.17 | Profit: Open Day1 ($ 182.05) | Engulfing | Buy |
| 002 22 Mar 2024 | Sell Price: 183.17 | Profit: Close Day1 ($ 182.01) | Engulfing | Sell |
| 003 20 Mar 2024 | Buy Price: 183.68 | Profit: Open Day1 ($ 184.52) | Engulfing | Buy |
| 004 20 Mar 2024 | Buy Price: 183.40 | Profit: Open Day1 ($ 184.52) | Piercing Line | Buy |
| 005 15 Mar 2024 | Buy Price: 183.82 | Profit: Open Day1 ($ 184.05) | Piercing Line | Buy |
| 006 22 Feb 2024 | Sell Price: 176.12 | Profit: Open Day1 ($ 175.99) | Engulfing | Sell |
| 007 23 Jan 2024 | Sell Price: 179.59 | Profit: Close Day1 ($ 176.03) | Engulfing | Sell |
| 008 14 Nov 2023 | Buy Price: 171.87 | Loss: Close Day2 ($ 169.78) | Abandoned Baby | Buy |
| 009 27 Oct 2023 | Sell Price: 162.59 | Loss: Close Day2 ($ 165.74) | Engulfing | Sell |
| 010 18 Sep 2023 | Sell Price: 181.98 | Profit: Close Day1 ($ 181.25) | Engulfing | Sell |
| 011 07 Sep 2023 | Buy Price: 181.22 | Profit: Open Day1 ($ 181.59) | Engulfing | Buy |
| 012 08 Aug 2023 | Sell Price: 185.44 | Profit: Open Day1 ($ 184.69) | Abandoned Baby | Sell |
| 013One Year Average | Both Sides Result for 12 Signals |
Profit: $ 5.53 ($ 0.46 / Signal) |
All of Them | Buy + Sell |
| Simple Moving Averages (SMA) Period | Value $ | Signal | Exponential Moving Averages (EMA) Period | Value $ | Signal | |
|---|---|---|---|---|---|---|
| 2 | 192.65 | BUY | 2 | 192.29 | BUY | |
| 3 | 191.08 | BUY | 3 | 191.81 | BUY | |
| 5 | 190.76 | BUY | 5 | 191.18 | BUY | |
| 8 | 190.99 | BUY | 8 | 190.33 | BUY | |
| 13 | 188.50 | BUY | 13 | 189.07 | BUY | |
| 21 | 186.77 | BUY | 21 | 187.57 | BUY | |
| 34 | 185.06 | BUY | 34 | 185.92 | BUY | |
| 55 | 183.25 | BUY | 55 | 184.21 | BUY | |
| 90 | 181.87 | BUY | 90 | 182.53 | BUY | |
| 200 | 179.65 | BUY | 200 | 180.96 | BUY |
Avalonbay Communities Inc
IPO: 1994-03-11
Ticker: AVBIndices: S&P 500,
Exchange: New York Stock Exchange, Inc. (US - USD)
Website: https://www.avaloncommunities.com/
Phone:
REIT (Real Estate Investment Trust)
Real Estate & Construction (
Real Estate Investment Trusts
 Click to Enlarge