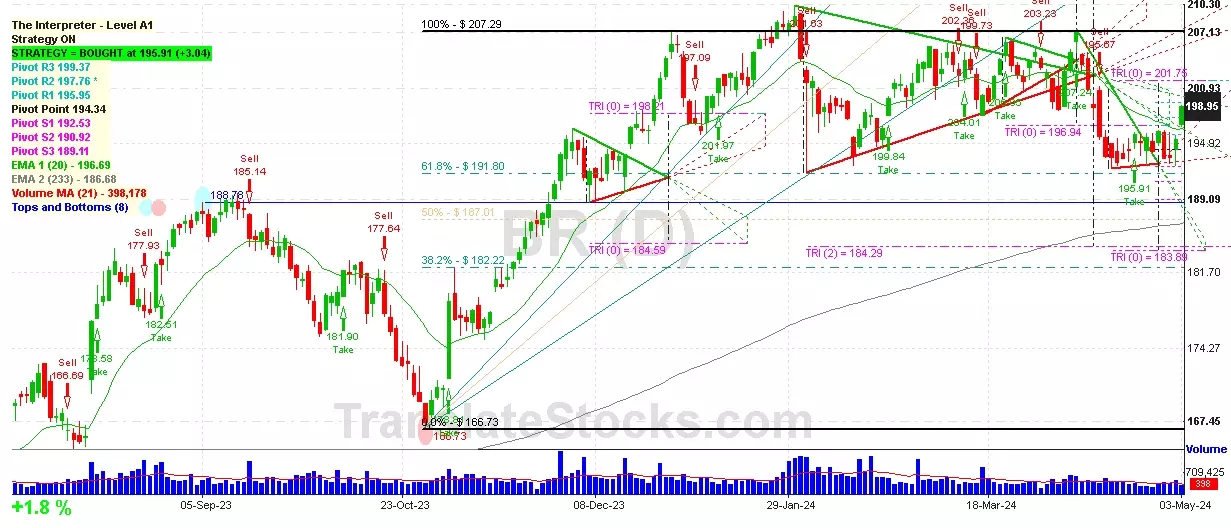
Hey Friend, I'm analysing BROADRIDGE FINANCIAL SOLUTIO (BR), and it is between the Support of $ 198.21 (Triangle Projection Level 0) and the Resistance of $ 199.37 (PivotR3). The stock is also approaching the line of PivotR3 at $ 199.37, and if it goes above this line it could reach the next Resistance of Triangle projection at $201.75.

| Date | Price $ | Result % | Candle Name | Side |
|---|---|---|---|---|
| 001 25 Apr 2024 | Buy Price: 195.56 | Profit: Close Day2 ($ 196.29) | Engulfing | Buy |
| 002 01 Apr 2024 | Sell Price: 203.23 | Profit: Open Day1 ($ 202.05) | Abandoned Baby | Sell |
| 003 22 Mar 2024 | Sell Price: 203.51 | Profit: Open Day1 ($ 203.50) | Engulfing | Sell |
| 004 22 Mar 2024 | Sell Price: 203.49 | Profit: Close Day1 ($ 202.34) | Dark Cloud Cover | Sell |
| 005 12 Mar 2024 | Buy Price: 204.01 | Profit: Open Day1 ($ 204.13) | Engulfing | Buy |
| 006 08 Mar 2024 | Sell Price: 203.55 | Profit: Open Day1 ($ 203.06) | Engulfing | Sell |
| 007 31 Jan 2024 | Sell Price: 204.20 | Profit: Open Day1 ($ 202.92) | Engulfing | Sell |
| 008 08 Jan 2024 | Buy Price: 200.00 | Profit: Open Day2 ($ 200.53) | Abandoned Baby | Buy |
| 009 19 Sep 2023 | Buy Price: 185.76 | Profit: Open Day1 ($ 186.16) | Engulfing | Buy |
| 010 21 Jun 2023 | Buy Price: 159.68 | Profit: Open Day1 ($ 159.75) | Piercing Line | Buy |
| 011 20 Jun 2023 | Sell Price: 158.78 | Profit: Open Day1 ($ 158.13) | Abandoned Baby | Sell |
| 012 30 May 2023 | Sell Price: 147.79 | Profit: Open Day1 ($ 147.71) | Engulfing | Sell |
| 013 19 May 2023 | Sell Price: 153.27 | Profit: Open Day2 ($ 152.72) | Dark Cloud Cover | Sell |
| 014One Year Average | Both Sides Result for 13 Signals |
Profit: $ 7.24 ($ 0.56 / Signal) |
All of Them | Buy + Sell |
| Simple Moving Averages (SMA) Period | Value $ | Signal | Exponential Moving Averages (EMA) Period | Value $ | Signal | |
|---|---|---|---|---|---|---|
| 2 | 197.15 | BUY | 2 | 197.55 | BUY | |
| 3 | 195.91 | BUY | 3 | 196.78 | BUY | |
| 5 | 195.49 | BUY | 5 | 196.04 | BUY | |
| 8 | 195.28 | BUY | 8 | 195.70 | BUY | |
| 13 | 194.78 | BUY | 13 | 195.92 | BUY | |
| 21 | 197.12 | BUY | 21 | 196.77 | BUY | |
| 34 | 199.16 | SELL | 34 | 197.87 | BUY | |
| 55 | 199.97 | SELL | 55 | 198.45 | BUY | |
| 90 | 200.70 | SELL | 90 | 197.29 | BUY | |
| 200 | 190.17 | BUY | 200 | 188.95 | BUY |
Broadridge Financial Solutio
IPO: 2007-03-22
Ticker: BRIndices: S&P 500,
Exchange: New York Stock Exchange, Inc. (US - USD)
Website: https://www.broadridge.com/
Phone:
Common Stock
Trade & Services (
Services-business Services, Nec
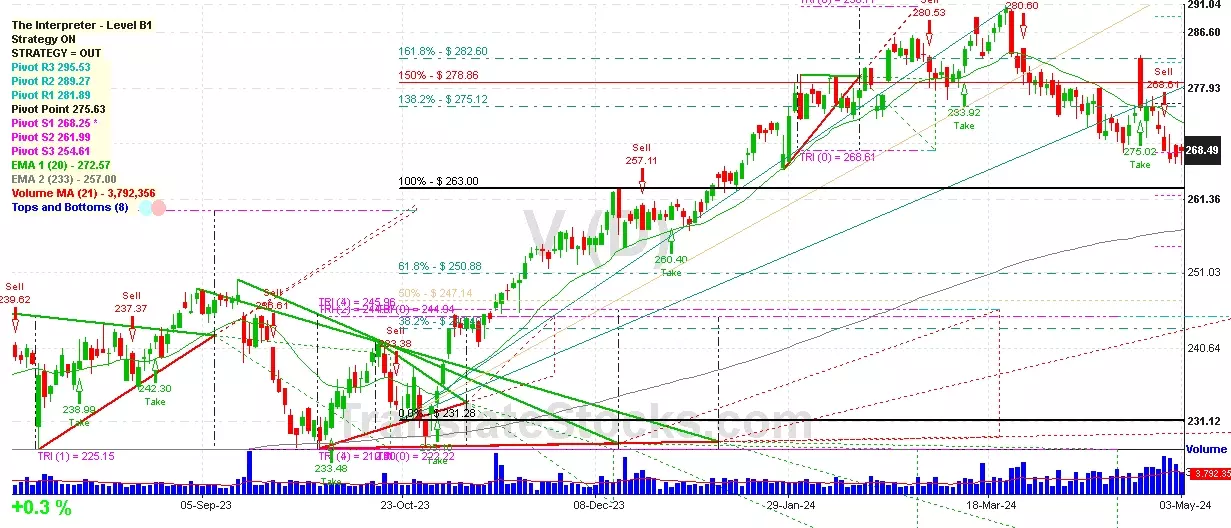
 Click to Enlarge
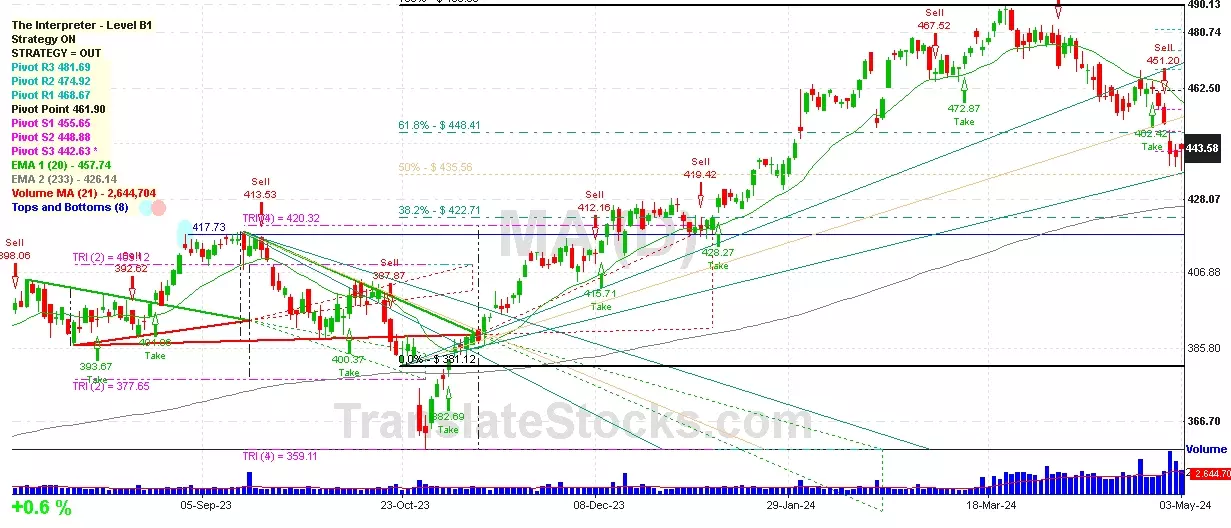