| Date | Price $ | Result % | Candle Name | Side |
|---|---|---|---|---|
| 001 13 Mar 2024 | Sell Price: 111.08 | Profit: Open Day1 ($ 110.67) | Engulfing | Sell |
| 002 18 Jan 2024 | Buy Price: 106.39 | Profit: Open Day1 ($ 106.68) | Piercing Line | Buy |
| 003 17 Jan 2024 | Sell Price: 105.46 | Profit: Open Day1 ($ 104.78) | Engulfing | Sell |
| 004 26 Dec 2023 | Sell Price: 101.14 | Profit: Open Day1 ($ 100.88) | Abandoned Baby | Sell |
| 005 16 Oct 2023 | Sell Price: 92.66 | Loss: Close Day2 ($ 93.81) | Dark Cloud Cover | Sell |
| 006 06 Sep 2023 | Buy Price: 87.25 | Profit: Open Day1 ($ 87.90) | Piercing Line | Buy |
| 007 25 Jul 2023 | Buy Price: 93.73 | Loss: Close Day2 ($ 92.42) | Engulfing | Buy |
| 008 11 Jul 2023 | Buy Price: 94.36 | Loss: Close Day2 ($ 93.42) | Abandoned Baby | Buy |
| 009 31 May 2023 | Buy Price: 82.30 | Profit: Open Day1 ($ 82.84) | Engulfing | Buy |
| 010 15 May 2023 | Buy Price: 85.32 | Profit: Open Day1 ($ 85.42) | Engulfing | Buy |
| 011One Year Average | Both Sides Result for 10 Signals |
Loss: $ -0.47 ($ -0.05 / Signal) |
All of Them | Buy + Sell |
| Simple Moving Averages (SMA) Period | Value $ | Signal | Exponential Moving Averages (EMA) Period | Value $ | Signal | |
|---|---|---|---|---|---|---|
| 2 | 98.77 | SELL | 2 | 99.15 | SELL | |
| 3 | 100.17 | SELL | 3 | 99.74 | SELL | |
| 5 | 101.14 | SELL | 5 | 100.62 | SELL | |
| 8 | 101.96 | SELL | 8 | 101.56 | SELL | |
| 13 | 103.04 | SELL | 13 | 102.78 | SELL | |
| 21 | 104.63 | SELL | 21 | 104.25 | SELL | |
| 34 | 107.26 | SELL | 34 | 105.67 | SELL | |
| 55 | 108.59 | SELL | 55 | 106.38 | SELL | |
| 90 | 107.06 | SELL | 90 | 105.75 | SELL | |
| 200 | 100.30 | SELL | 200 | 100.54 | SELL |
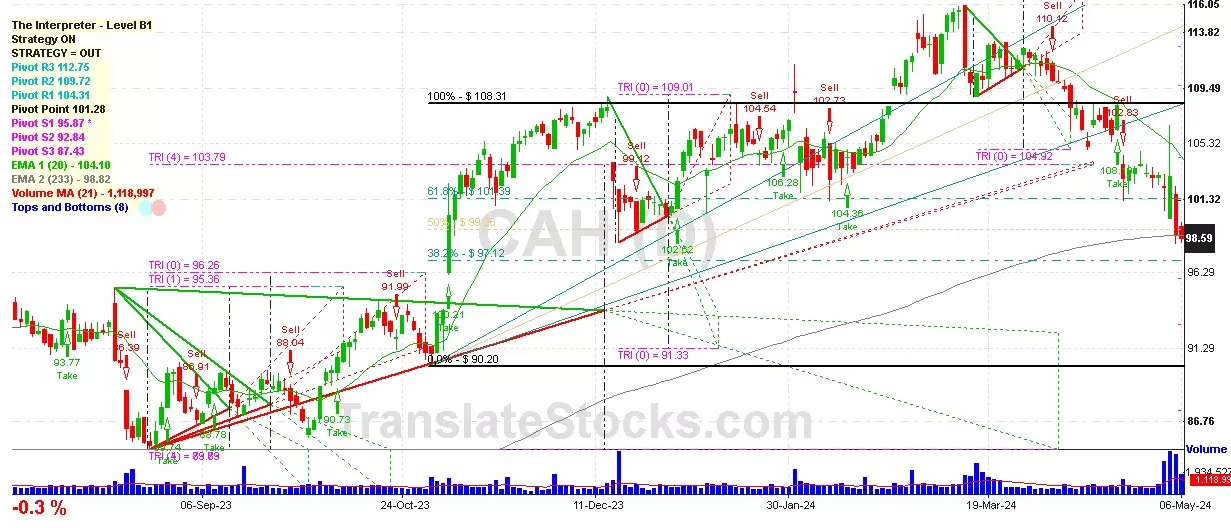
Cardinal Health Inc
IPO: 1994-09-07
Ticker: CAHIndices: S&P 500,
Exchange: New York Stock Exchange, Inc. (US - USD)
Website: https://www.cardinalhealth.com/
Phone:
Common Stock
Trade & Services (
Wholesale-drugs, Proprietaries & Druggists' Sundries

 Click to Enlarge