| Date | Price $ | Result % | Candle Name | Side |
|---|---|---|---|---|
| 001 23 Apr 2024 | Sell Price: 40.36 | Profit: Open Day1 ($ 39.96) | Abandoned Baby | Sell |
| 002 23 Apr 2024 | Sell Price: 40.36 | Profit: Open Day1 ($ 39.96) | Engulfing | Sell |
| 003 01 Apr 2024 | Sell Price: 42.28 | Profit: Open Day1 ($ 42.18) | Abandoned Baby | Sell |
| 004 19 Mar 2024 | Sell Price: 42.99 | Profit: Open Day1 ($ 42.90) | Abandoned Baby | Sell |
| 005 02 Feb 2024 | Sell Price: 45.09 | Profit: Open Day1 ($ 44.95) | Abandoned Baby | Sell |
| 006 27 Dec 2023 | Buy Price: 44.01 | Profit: Close Day1 ($ 44.12) | Engulfing | Buy |
| 007 27 Dec 2023 | Buy Price: 43.99 | Profit: Close Day1 ($ 44.12) | Piercing Line | Buy |
| 008 21 Jul 2023 | Sell Price: 42.89 | Loss: Close Day2 ($ 43.30) | Engulfing | Sell |
| 009One Year Average | Both Sides Result for 8 Signals |
Profit: $ 0.96 ($ 0.12 / Signal) |
All of Them | Buy + Sell |
| Simple Moving Averages (SMA) Period | Value $ | Signal | Exponential Moving Averages (EMA) Period | Value $ | Signal | |
|---|---|---|---|---|---|---|
| 2 | 38.22 | BUY | 2 | 38.60 | SELL | |
| 3 | 38.88 | SELL | 3 | 38.81 | SELL | |
| 5 | 39.52 | SELL | 5 | 39.12 | SELL | |
| 8 | 39.55 | SELL | 8 | 39.38 | SELL | |
| 13 | 39.55 | SELL | 13 | 39.72 | SELL | |
| 21 | 40.29 | SELL | 21 | 40.21 | SELL | |
| 34 | 41.31 | SELL | 34 | 40.80 | SELL | |
| 55 | 41.59 | SELL | 55 | 41.41 | SELL | |
| 90 | 42.58 | SELL | 90 | 41.95 | SELL | |
| 200 | 43.28 | SELL | 200 | 42.15 | SELL |
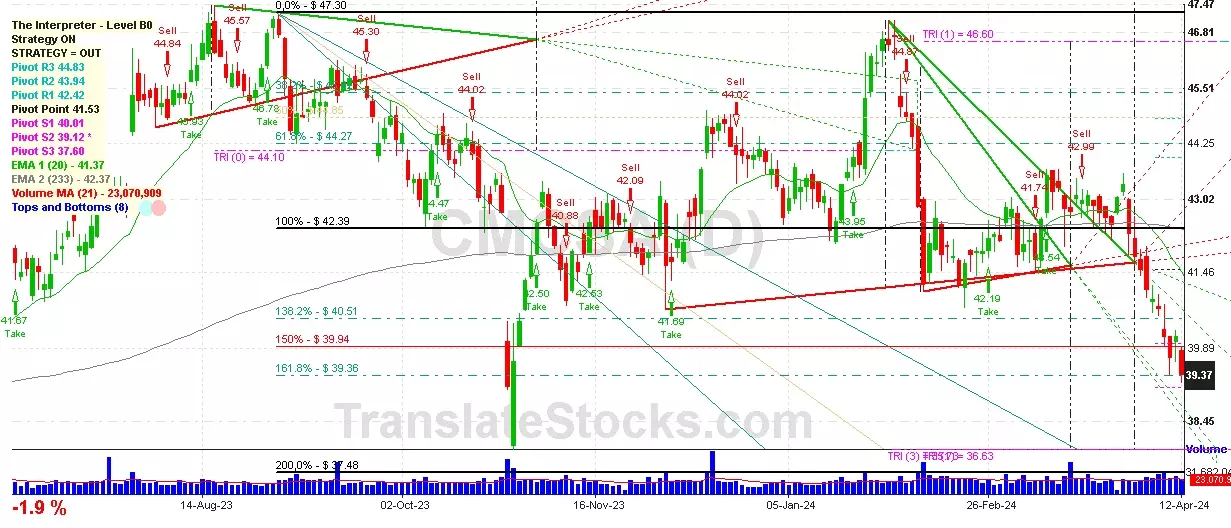
Comcast Corp-class A
IPO: 2001-12-07
Ticker: CMCSAIndices: S&P 500,
Nasdaq 100,
Exchange: Nasdaq Nms - Global Market (US - USD)
Website: https://corporate.comcast.com/
Phone:
Common Stock
Technology (
Cable & Other Pay Television Services

 Click to Enlarge