| Date | Price $ | Result % | Candle Name | Side |
|---|---|---|---|---|
| 001 19 Apr 2024 | Buy Price: 20.18 | Profit: Open Day1 ($ 20.32) | Abandoned Baby | Buy |
| 002 19 Apr 2024 | Buy Price: 20.14 | Profit: Open Day1 ($ 20.32) | Engulfing | Buy |
| 003 04 Apr 2024 | Sell Price: 20.90 | Profit: Open Day1 ($ 20.86) | Engulfing | Sell |
| 004 15 Mar 2024 | Buy Price: 20.64 | Profit: Close Day1 ($ 20.70) | Piercing Line | Buy |
| 005 13 Mar 2024 | Sell Price: 20.74 | Profit: Close Day1 ($ 20.51) | Abandoned Baby | Sell |
| 006 01 Mar 2024 | Sell Price: 21.69 | Profit: Open Day1 ($ 21.68) | Engulfing | Sell |
| 007 28 Feb 2024 | Sell Price: 21.57 | Loss: Close Day2 ($ 21.69) | Abandoned Baby | Sell |
| 008 16 Jan 2024 | Sell Price: 23.59 | Profit: Open Day1 ($ 22.45) | Abandoned Baby | Sell |
| 009 01 Dec 2023 | Buy Price: 23.64 | Profit: Close Day1 ($ 23.86) | Engulfing | Buy |
| 010 27 Oct 2023 | Sell Price: 19.55 | Loss: Close Day2 ($ 20.17) | Dark Cloud Cover | Sell |
| 011 19 Oct 2023 | Sell Price: 20.58 | Profit: Open Day1 ($ 20.50) | Engulfing | Sell |
| 012 12 Oct 2023 | Sell Price: 22.20 | Profit: Close Day1 ($ 21.68) | Engulfing | Sell |
| 013 05 Oct 2023 | Buy Price: 21.24 | Profit: Close Day1 ($ 21.37) | Engulfing | Buy |
| 014 19 Jul 2023 | Sell Price: 28.16 | Profit: Open Day1 ($ 28.13) | Dark Cloud Cover | Sell |
| 015One Year Average | Both Sides Result for 14 Signals |
Profit: $ 2.04 ($ 0.15 / Signal) |
All of Them | Buy + Sell |
| Simple Moving Averages (SMA) Period | Value $ | Signal | Exponential Moving Averages (EMA) Period | Value $ | Signal | |
|---|---|---|---|---|---|---|
| 2 | 19.03 | BUY | 2 | 19.11 | BUY | |
| 3 | 19.02 | BUY | 3 | 19.17 | SELL | |
| 5 | 19.37 | SELL | 5 | 19.35 | SELL | |
| 8 | 19.79 | SELL | 8 | 19.58 | SELL | |
| 13 | 19.95 | SELL | 13 | 19.84 | SELL | |
| 21 | 20.27 | SELL | 21 | 20.10 | SELL | |
| 34 | 20.51 | SELL | 34 | 20.39 | SELL | |
| 55 | 20.73 | SELL | 55 | 20.74 | SELL | |
| 90 | 21.47 | SELL | 90 | 21.16 | SELL | |
| 200 | 21.79 | SELL | 200 | 22.20 | SELL |
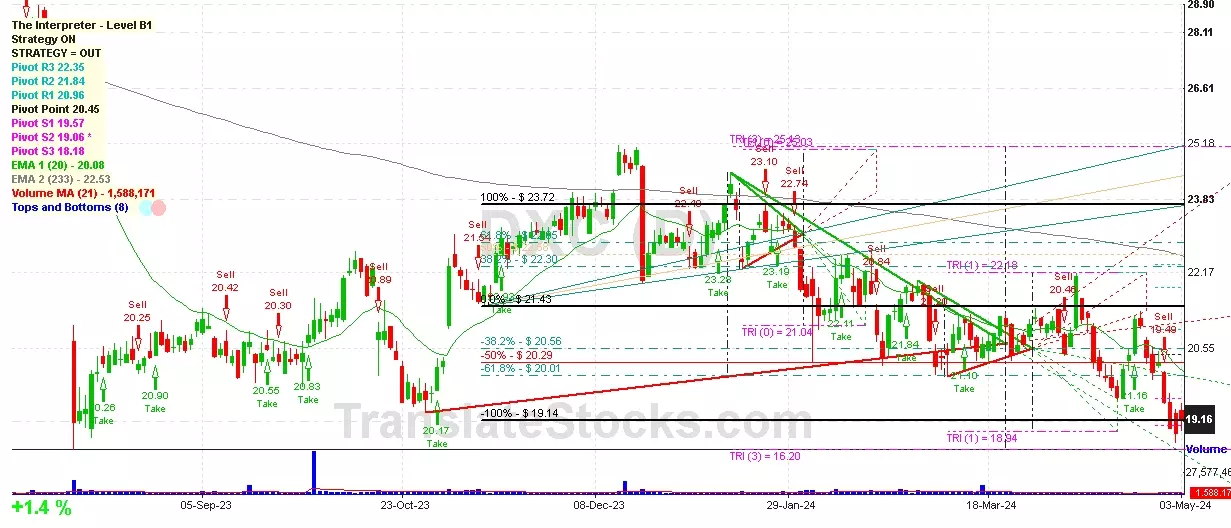
Dxc Technology Co
IPO: 2017-03-16
Ticker: DXCIndices: S&P 500,
Exchange: New York Stock Exchange, Inc. (US - USD)
Website: http://www.dxc.technology/
Phone:
Common Stock
Technology (
Services-computer Processing & Data Preparation

 Click to Enlarge