| Date | Price $ | Result % | Candle Name | Side |
|---|---|---|---|---|
| 001 26 Apr 2024 | Sell Price: 223.42 | Profit: Close Day2 ($ 220.19) | Engulfing | Sell |
| 002 04 Apr 2024 | Sell Price: 252.04 | Profit: Open Day1 ($ 251.13) | Engulfing | Sell |
| 003 01 Apr 2024 | Sell Price: 260.73 | Profit: Open Day1 ($ 257.00) | Engulfing | Sell |
| 004 29 Feb 2024 | Buy Price: 273.59 | Loss: Close Day2 ($ 269.17) | Abandoned Baby | Buy |
| 005 28 Feb 2024 | Sell Price: 267.31 | Loss: Close Day2 ($ 270.98) | Abandoned Baby | Sell |
| 006 26 Feb 2024 | Sell Price: 266.12 | Loss: Close Day2 ($ 267.31) | Abandoned Baby | Sell |
| 007 26 Feb 2024 | Sell Price: 265.25 | Loss: Close Day2 ($ 267.31) | Engulfing | Sell |
| 008 09 Feb 2024 | Sell Price: 249.18 | Profit: Close Day2 ($ 247.94) | Engulfing | Sell |
| 009 09 Feb 2024 | Sell Price: 249.60 | Profit: Close Day2 ($ 247.94) | Dark Cloud Cover | Sell |
| 010 12 Jan 2024 | Buy Price: 243.76 | Profit: Close Day1 ($ 246.45) | Abandoned Baby | Buy |
| 011 09 Nov 2023 | Sell Price: 184.37 | Profit: Open Day2 ($ 183.91) | Dark Cloud Cover | Sell |
| 012 19 Oct 2023 | Buy Price: 179.74 | Loss: Close Day2 ($ 179.04) | Engulfing | Buy |
| 013 19 Oct 2023 | Buy Price: 178.98 | Profit: Open Day1 ($ 179.51) | Piercing Line | Buy |
| 014 21 Jun 2023 | Buy Price: 228.76 | Loss: Close Day2 ($ 224.03) | Engulfing | Buy |
| 015 16 Jun 2023 | Sell Price: 229.77 | Profit: Open Day1 ($ 228.13) | Dark Cloud Cover | Sell |
| 016 31 May 2023 | Sell Price: 208.62 | Profit: Close Day1 ($ 208.55) | Abandoned Baby | Sell |
| 017One Year Average | Both Sides Result for 16 Signals |
Loss: $ -0.61 ($ -0.04 / Signal) |
All of Them | Buy + Sell |
| Simple Moving Averages (SMA) Period | Value $ | Signal | Exponential Moving Averages (EMA) Period | Value $ | Signal | |
|---|---|---|---|---|---|---|
| 2 | 222.59 | BUY | 2 | 223.35 | BUY | |
| 3 | 221.79 | BUY | 3 | 223.06 | BUY | |
| 5 | 222.86 | BUY | 5 | 223.18 | BUY | |
| 8 | 223.84 | BUY | 8 | 224.31 | BUY | |
| 13 | 224.59 | SELL | 13 | 227.61 | SELL | |
| 21 | 235.11 | SELL | 21 | 233.11 | SELL | |
| 34 | 244.81 | SELL | 34 | 239.22 | SELL | |
| 55 | 252.17 | SELL | 55 | 242.89 | SELL | |
| 90 | 249.69 | SELL | 90 | 241.46 | SELL | |
| 200 | 221.63 | BUY | 200 | 230.53 | SELL |
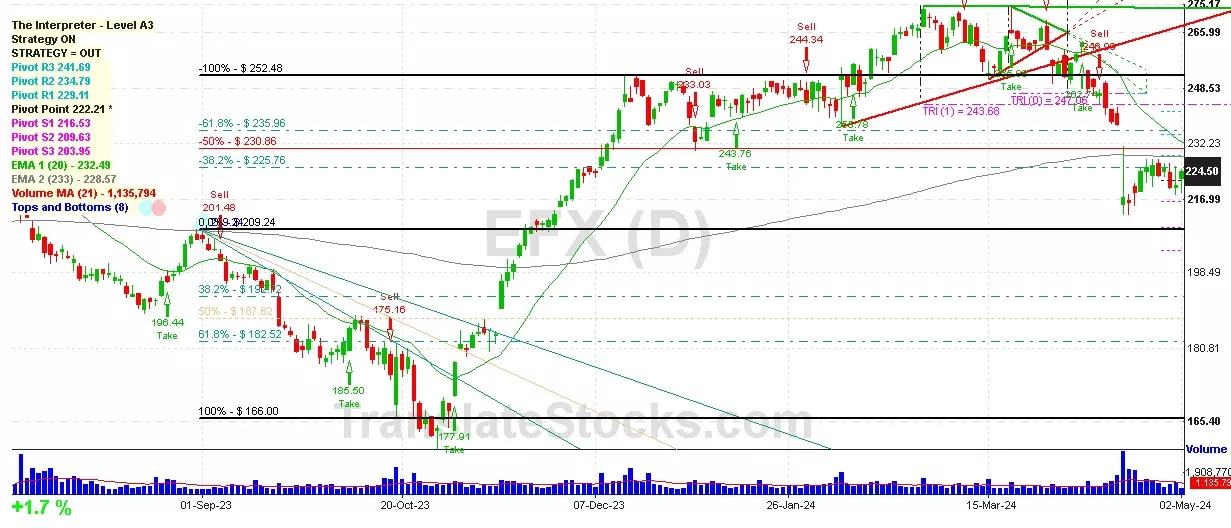
Equifax Inc
IPO: 1971-05-11
Ticker: EFXIndices: S&P 500,
Exchange: New York Stock Exchange, Inc. (US - USD)
Website: https://www.equifax.com/
Phone:
Common Stock
Trade & Services (
Services-consumer Credit Reporting, Collection Agencies

 Click to Enlarge