| Date | Price $ | Result % | Candle Name | Side |
|---|---|---|---|---|
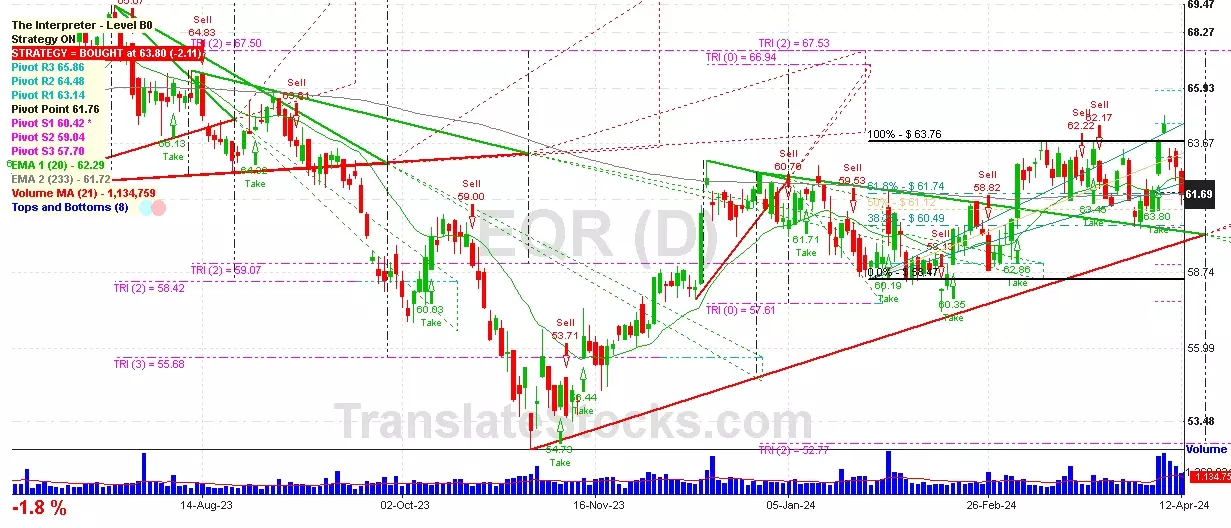
| 001 03 Apr 2024 | Buy Price: 61.42 | Profit: Open Day1 ($ 61.88) | Engulfing | Buy |
| 002 14 Feb 2024 | Buy Price: 58.65 | Profit: Open Day1 ($ 59.05) | Abandoned Baby | Buy |
| 003 22 Jan 2024 | Sell Price: 60.30 | Profit: Close Day1 ($ 59.53) | Dark Cloud Cover | Sell |
| 004 16 Jan 2024 | Sell Price: 61.44 | Profit: Open Day1 ($ 60.62) | Abandoned Baby | Sell |
| 005 17 Oct 2023 | Buy Price: 60.16 | Loss: Close Day2 ($ 58.49) | Piercing Line | Buy |
| 006 12 Sep 2023 | Buy Price: 63.14 | Profit: Open Day1 ($ 63.28) | Engulfing | Buy |
| 007 24 Jul 2023 | Sell Price: 68.64 | Profit: Open Day1 ($ 68.48) | Engulfing | Sell |
| 008 12 Jun 2023 | Sell Price: 65.65 | Profit: Open Day1 ($ 65.39) | Engulfing | Sell |
| 009One Year Average | Both Sides Result for 8 Signals |
Profit: $ 1.34 ($ 0.17 / Signal) |
All of Them | Buy + Sell |
| Simple Moving Averages (SMA) Period | Value $ | Signal | Exponential Moving Averages (EMA) Period | Value $ | Signal | |
|---|---|---|---|---|---|---|
| 2 | 65.01 | BUY | 2 | 64.96 | BUY | |
| 3 | 64.88 | BUY | 3 | 64.68 | BUY | |
| 5 | 64.05 | BUY | 5 | 64.10 | BUY | |
| 8 | 62.90 | BUY | 8 | 63.51 | BUY | |
| 13 | 62.38 | BUY | 13 | 63.00 | BUY | |
| 21 | 62.34 | BUY | 21 | 62.63 | BUY | |
| 34 | 62.39 | BUY | 34 | 62.27 | BUY | |
| 55 | 61.65 | BUY | 55 | 61.82 | BUY | |
| 90 | 61.24 | BUY | 90 | 61.35 | BUY | |
| 200 | 61.03 | BUY | 200 | 61.44 | BUY |
Equity Residential
IPO: 1993-08-12
Ticker: EQRIndices: S&P 500,
Exchange: New York Stock Exchange, Inc. (US - USD)
Website: http://www.equityapartments.com/
Phone:
REIT (Real Estate Investment Trust)
Real Estate & Construction (
Real Estate Investment Trusts

 Click to Enlarge