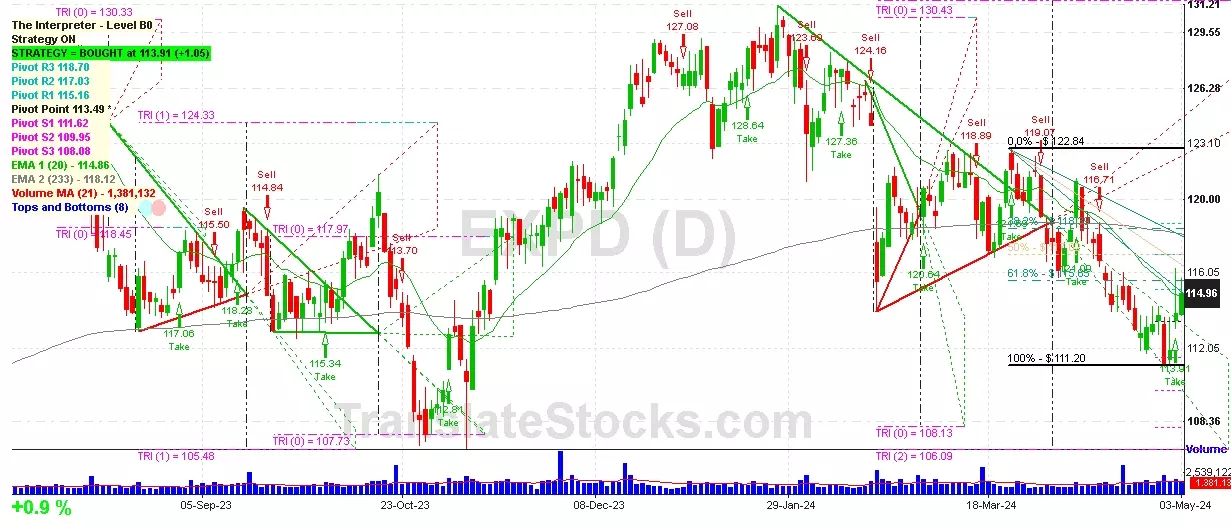
Hey Friend, I'm analysing EXPEDITORS INTL WASH INC (EXPD), and it is between the Support of $ 113.49 (Pivot) and the Resistance of $ 115.16 (PivotR1). The stock is also approaching the line of PivotR1 at $ 115.16, and if it goes above this line it could reach the next Resistance of 61.8% of Fibonacci at $ 115.65.

| Date | Price $ | Result % | Candle Name | Side |
|---|---|---|---|---|
| 001 30 Apr 2024 | Sell Price: 111.31 | Loss: Close Day2 ($ 113.91) | Abandoned Baby | Sell |
| 002 01 Apr 2024 | Sell Price: 119.07 | Profit: Open Day1 ($ 118.40) | Abandoned Baby | Sell |
| 003 25 Mar 2024 | Sell Price: 120.06 | Profit: Close Day1 ($ 119.94) | Abandoned Baby | Sell |
| 004 08 Mar 2024 | Sell Price: 121.26 | Profit: Open Day1 ($ 120.90) | Engulfing | Sell |
| 005 09 Feb 2024 | Buy Price: 127.36 | Loss: Close Day2 ($ 125.26) | Engulfing | Buy |
| 006 02 Feb 2024 | Buy Price: 124.33 | Profit: Close Day1 ($ 124.57) | Piercing Line | Buy |
| 007 08 Jan 2024 | Sell Price: 126.27 | Profit: Open Day1 ($ 125.34) | Engulfing | Sell |
| 008 08 Nov 2023 | Buy Price: 113.21 | Profit: Open Day1 ($ 114.00) | Engulfing | Buy |
| 009 30 May 2023 | Sell Price: 115.10 | Profit: Open Day1 ($ 114.06) | Dark Cloud Cover | Sell |
| 010 17 May 2023 | Buy Price: 113.45 | Profit: Open Day1 ($ 113.66) | Abandoned Baby | Buy |
| 011One Year Average | Both Sides Result for 10 Signals |
Loss: $ -0.34 ($ -0.03 / Signal) |
All of Them | Buy + Sell |
| Simple Moving Averages (SMA) Period | Value $ | Signal | Exponential Moving Averages (EMA) Period | Value $ | Signal | |
|---|---|---|---|---|---|---|
| 2 | 114.44 | BUY | 2 | 114.40 | BUY | |
| 3 | 113.62 | BUY | 3 | 114.01 | BUY | |
| 5 | 113.19 | BUY | 5 | 113.66 | BUY | |
| 8 | 113.16 | BUY | 8 | 113.64 | BUY | |
| 13 | 113.55 | BUY | 13 | 114.07 | BUY | |
| 21 | 115.23 | SELL | 21 | 114.97 | SELL | |
| 34 | 116.79 | SELL | 34 | 116.28 | SELL | |
| 55 | 118.15 | SELL | 55 | 117.78 | SELL | |
| 90 | 121.57 | SELL | 90 | 118.90 | SELL | |
| 200 | 119.46 | SELL | 200 | 118.46 | SELL |
Expeditors Intl Wash Inc
IPO: 2005-06-06
Ticker: EXPDIndices: S&P 500,
Exchange: Nasdaq Nms - Global Market (US - USD)
Website: https://www.expeditors.com/
Phone:
Common Stock
Energy & Transportation (
Arrangement Of Transportation Of Freight & Cargo
 Click to Enlarge