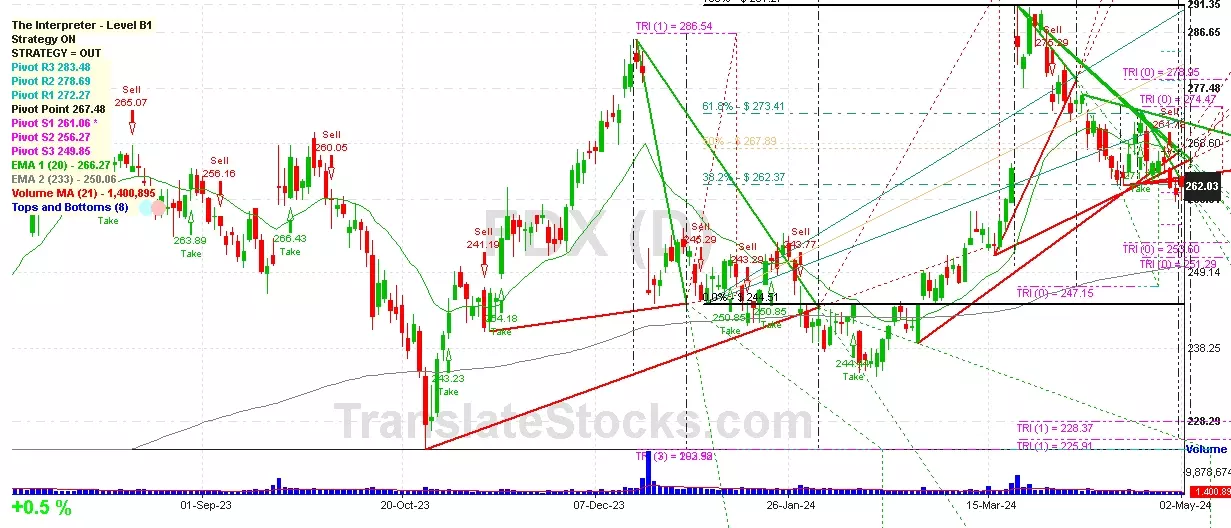
Hey Friend, I'm analysing FEDEX CORP (FDX), and it is between the Support of $ 261.06 (PivotS1) and the Resistance of $ 262.37 (38.2% of Fibonacci). The stock is also approaching the line of PivotS1 at $ 261.06, and if it goes below this line it could reach the next Support of Triangle projection at $253.60.

| Date | Price $ | Result % | Candle Name | Side |
|---|---|---|---|---|
| 001 30 Apr 2024 | Sell Price: 261.78 | Profit: Open Day1 ($ 261.65) | Abandoned Baby | Sell |
| 002 26 Jan 2024 | Sell Price: 251.55 | Profit: Open Day1 ($ 250.86) | Engulfing | Sell |
| 003 27 Dec 2023 | Sell Price: 250.94 | Profit: Open Day1 ($ 250.78) | Dark Cloud Cover | Sell |
| 004 15 Sep 2023 | Sell Price: 254.08 | Profit: Open Day1 ($ 253.79) | Dark Cloud Cover | Sell |
| 005 11 Sep 2023 | Buy Price: 254.70 | Loss: Close Day2 ($ 252.16) | Abandoned Baby | Buy |
| 006 30 Jun 2023 | Sell Price: 247.90 | Profit: Open Day1 ($ 247.11) | Engulfing | Sell |
| 007 19 May 2023 | Sell Price: 229.08 | Profit: Open Day1 ($ 229.02) | Engulfing | Sell |
| 008One Year Average | Both Sides Result for 7 Signals |
Loss: $ -0.42 ($ -0.06 / Signal) |
All of Them | Buy + Sell |
| Simple Moving Averages (SMA) Period | Value $ | Signal | Exponential Moving Averages (EMA) Period | Value $ | Signal | |
|---|---|---|---|---|---|---|
| 2 | 261.38 | BUY | 2 | 261.87 | BUY | |
| 3 | 261.51 | BUY | 3 | 262.18 | SELL | |
| 5 | 263.25 | SELL | 5 | 263.00 | SELL | |
| 8 | 264.95 | SELL | 8 | 264.06 | SELL | |
| 13 | 265.24 | SELL | 13 | 265.41 | SELL | |
| 21 | 267.91 | SELL | 21 | 266.29 | SELL | |
| 34 | 270.04 | SELL | 34 | 265.44 | SELL | |
| 55 | 260.78 | BUY | 55 | 262.92 | SELL | |
| 90 | 255.31 | BUY | 90 | 259.78 | BUY | |
| 200 | 256.52 | BUY | 200 | 252.15 | BUY |
Fedex Corp
IPO: 1978-12-28
Ticker: FDXIndices: S&P 500,
Exchange: New York Stock Exchange, Inc. (US - USD)
Website: http://www.fedex.com/
Phone:
Common Stock
Energy & Transportation (
Air Courier Services
 Click to Enlarge