Hey Friend, I'm analysing FIRSTENERGY CORP (FE), and it is between the Support of $ 39.18 (PivotR2) and the Resistance of $ 39.42 (Triangle Projection Level 0). The stock is also approaching the line of PivotR2 at $ 39.18, and if it goes below this line it could reach the next Support of 100% of Fibonacci at $ 38.57.

| Date | Price $ | Result % | Candle Name | Side |
|---|---|---|---|---|
| 001 08 Apr 2024 | Buy Price: 38.37 | Profit: Open Day1 ($ 38.50) | Abandoned Baby | Buy |
| 002 01 Apr 2024 | Sell Price: 38.37 | Profit: Close Day2 ($ 38.14) | Engulfing | Sell |
| 003 04 Mar 2024 | Buy Price: 37.27 | Profit: Open Day1 ($ 37.47) | Engulfing | Buy |
| 004 20 Feb 2024 | Sell Price: 37.15 | Loss: Close Day2 ($ 37.30) | Engulfing | Sell |
| 005 07 Feb 2024 | Buy Price: 35.83 | Profit: Open Day2 ($ 36.00) | Abandoned Baby | Buy |
| 006 30 Aug 2023 | Sell Price: 36.29 | Profit: Close Day1 ($ 36.07) | Abandoned Baby | Sell |
| 007 25 Jul 2023 | Buy Price: 40.08 | Loss: Close Day2 ($ 39.24) | Engulfing | Buy |
| 008 25 Jul 2023 | Buy Price: 40.05 | Loss: Close Day2 ($ 39.24) | Piercing Line | Buy |
| 009One Year Average | Both Sides Result for 8 Signals |
Loss: $ -0.85 ($ -0.11 / Signal) |
All of Them | Buy + Sell |
| Simple Moving Averages (SMA) Period | Value $ | Signal | Exponential Moving Averages (EMA) Period | Value $ | Signal | |
|---|---|---|---|---|---|---|
| 2 | 39.17 | BUY | 2 | 39.14 | BUY | |
| 3 | 39.01 | BUY | 3 | 39.03 | BUY | |
| 5 | 38.83 | BUY | 5 | 38.87 | BUY | |
| 8 | 38.64 | BUY | 8 | 38.69 | BUY | |
| 13 | 38.36 | BUY | 13 | 38.49 | BUY | |
| 21 | 38.13 | BUY | 21 | 38.32 | BUY | |
| 34 | 38.19 | BUY | 34 | 38.15 | BUY | |
| 55 | 37.89 | BUY | 55 | 37.93 | BUY | |
| 90 | 37.57 | BUY | 90 | 37.69 | BUY | |
| 200 | 36.95 | BUY | 200 | 37.60 | BUY |
Firstenergy Corp
IPO: 1946-09-13
Ticker: FEIndices: S&P 500,
Exchange: New York Stock Exchange, Inc. (US - USD)
Website: https://www.firstenergycorp.com/
Phone:
Common Stock
Energy & Transportation (
Electric Services
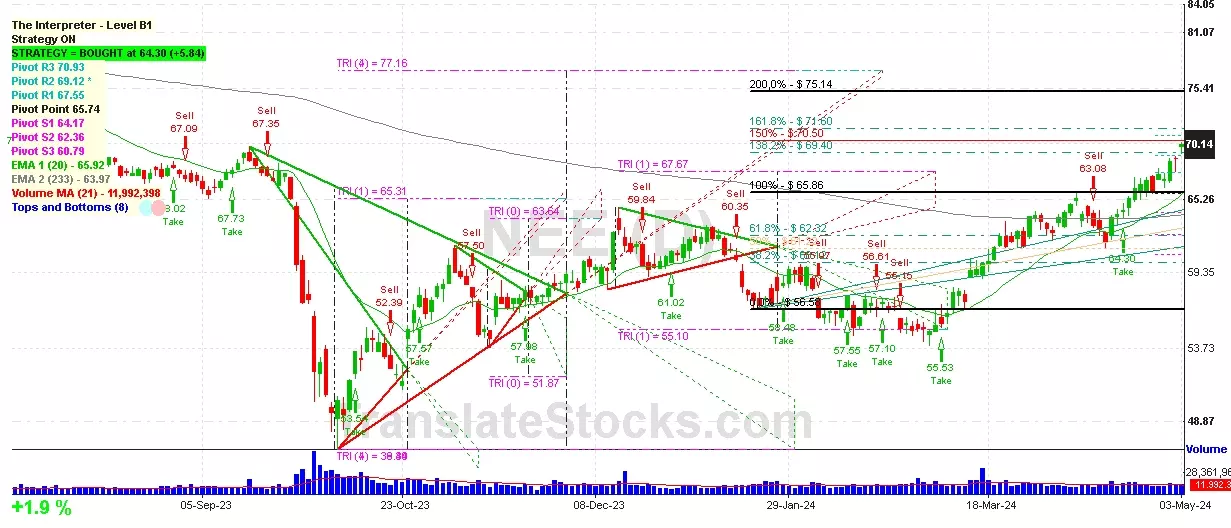
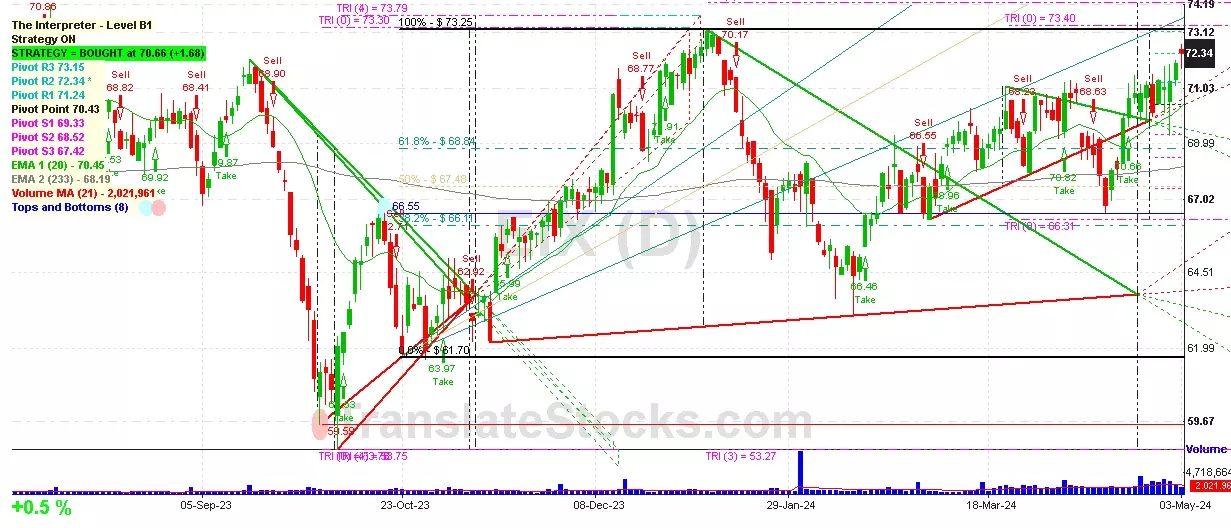
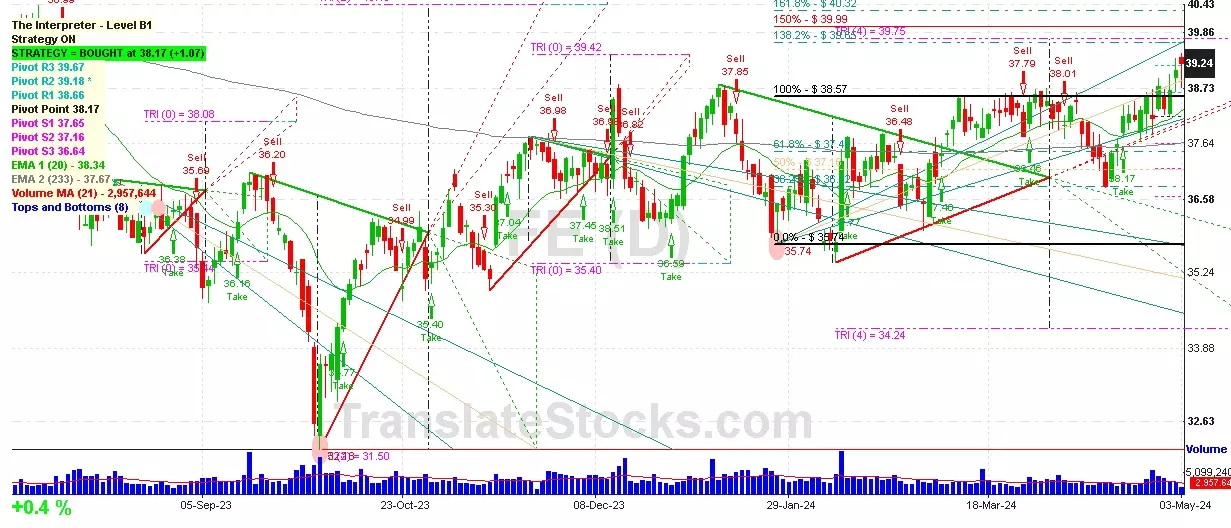 Click to Enlarge
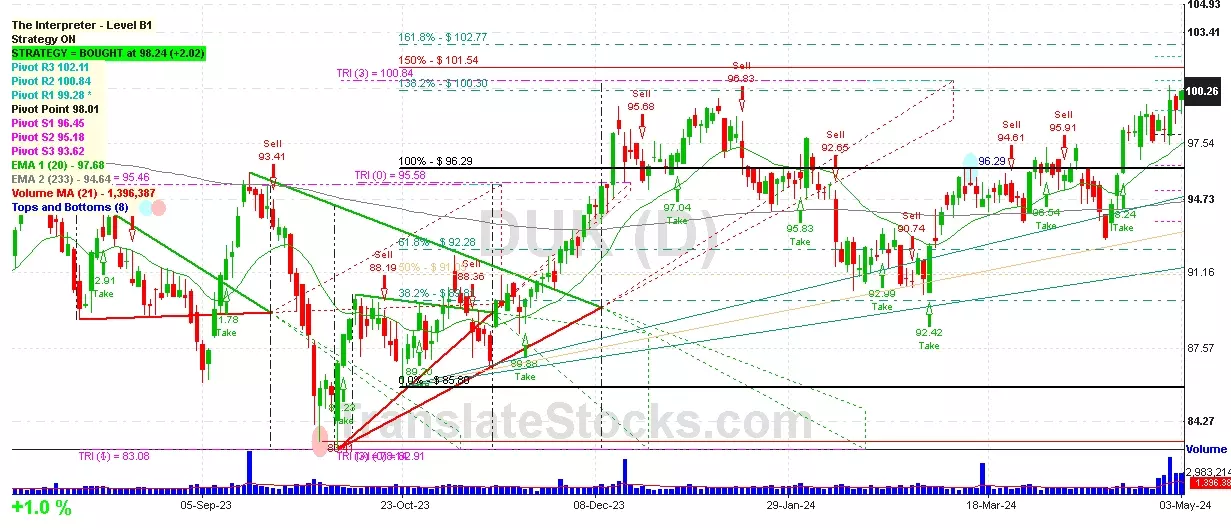