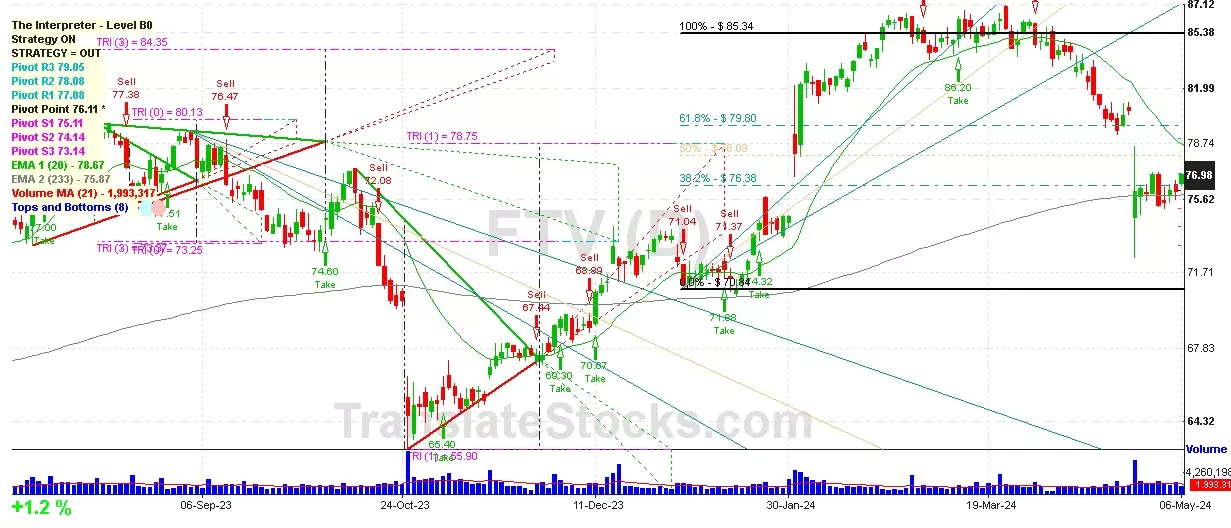
Hey Friend, I'm analysing FORTIVE CORP (FTV), and it is between the Support of $ 76.38 (38.2% of Fibonacci) and the Resistance of $ 77.08 (PivotR1). The stock is also approaching the line of PivotR1 at $ 77.08, and if it goes above this line it could reach the next Resistance of 50% of Fibonacci at $ 78.09.

| Date | Price $ | Result % | Candle Name | Side |
|---|---|---|---|---|
| 001 24 Apr 2024 | Sell Price: 76.05 | Profit: Open Day1 ($ 75.80) | Abandoned Baby | Sell |
| 002 14 Nov 2023 | Buy Price: 66.94 | Profit: Open Day1 ($ 67.02) | Abandoned Baby | Buy |
| 003 29 Sep 2023 | Sell Price: 74.16 | Profit: Open Day1 ($ 73.95) | Dark Cloud Cover | Sell |
| 004 14 Sep 2023 | Buy Price: 76.22 | Profit: Close Day2 ($ 76.46) | Abandoned Baby | Buy |
| 005 25 Jul 2023 | Buy Price: 74.16 | Profit: Open Day1 ($ 74.22) | Piercing Line | Buy |
| 006 03 Jul 2023 | Sell Price: 73.92 | Profit: Open Day1 ($ 73.17) | Abandoned Baby | Sell |
| 007One Year Average | Both Sides Result for 6 Signals |
Profit: $ 1.59 ($ 0.26 / Signal) |
All of Them | Buy + Sell |
| Simple Moving Averages (SMA) Period | Value $ | Signal | Exponential Moving Averages (EMA) Period | Value $ | Signal | |
|---|---|---|---|---|---|---|
| 2 | 76.53 | BUY | 2 | 76.66 | BUY | |
| 3 | 76.39 | BUY | 3 | 76.49 | BUY | |
| 5 | 75.97 | BUY | 5 | 76.42 | BUY | |
| 8 | 76.13 | BUY | 8 | 76.71 | BUY | |
| 13 | 77.37 | SELL | 13 | 77.54 | SELL | |
| 21 | 79.34 | SELL | 21 | 78.81 | SELL | |
| 34 | 81.56 | SELL | 34 | 80.03 | SELL | |
| 55 | 82.95 | SELL | 55 | 80.42 | SELL | |
| 90 | 80.26 | SELL | 90 | 79.61 | SELL | |
| 200 | 76.28 | BUY | 200 | 76.54 | BUY |
Fortive Corp
IPO: 2016-06-13
Ticker: FTVIndices: S&P 500,
Exchange: New York Stock Exchange, Inc. (US - USD)
Website: http://www.fortive.com/
Phone:
Common Stock
Life Sciences (
Industrial Instruments For Measurement, Display, And Control
 Click to Enlarge