| Date | Price $ | Result % | Candle Name | Side |
|---|---|---|---|---|
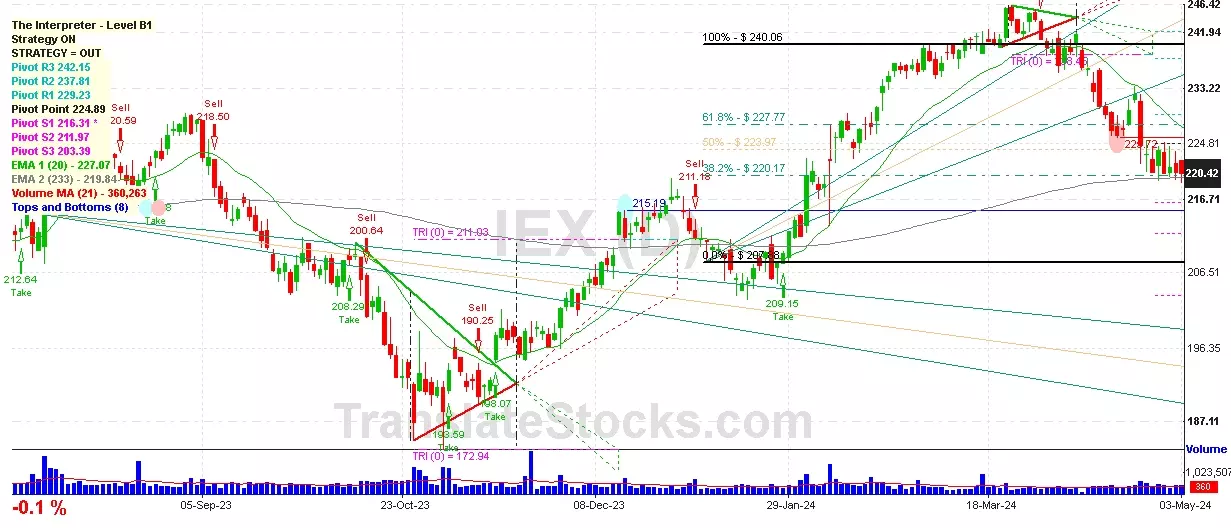
| 001 10 Apr 2024 | Sell Price: 236.39 | Profit: Open Day1 ($ 236.19) | Abandoned Baby | Sell |
| 002 20 Mar 2024 | Buy Price: 240.89 | Profit: Open Day1 ($ 241.12) | Piercing Line | Buy |
| 003 18 Mar 2024 | Buy Price: 240.56 | Profit: Open Day1 ($ 240.90) | Abandoned Baby | Buy |
| 004 29 Feb 2024 | Sell Price: 235.90 | Loss: Close Day2 ($ 237.62) | Engulfing | Sell |
| 005 18 Jan 2024 | Buy Price: 205.33 | Profit: Open Day1 ($ 205.70) | Abandoned Baby | Buy |
| 006 08 Dec 2023 | Sell Price: 204.84 | Loss: Close Day2 ($ 207.56) | Engulfing | Sell |
| 007 27 Nov 2023 | Sell Price: 198.60 | Profit: Open Day1 ($ 198.20) | Abandoned Baby | Sell |
| 008 08 Nov 2023 | Buy Price: 192.33 | Profit: Open Day1 ($ 193.61) | Abandoned Baby | Buy |
| 009 29 Sep 2023 | Sell Price: 208.02 | Profit: Open Day1 ($ 207.61) | Dark Cloud Cover | Sell |
| 010 18 Aug 2023 | Buy Price: 219.42 | Profit: Close Day1 ($ 221.22) | Piercing Line | Buy |
| 011 11 Aug 2023 | Buy Price: 223.41 | Loss: Close Day2 ($ 220.59) | Engulfing | Buy |
| 012 04 Aug 2023 | Sell Price: 220.89 | Loss: Close Day2 ($ 223.90) | Dark Cloud Cover | Sell |
| 013 19 Jul 2023 | Buy Price: 211.18 | Profit: Open Day1 ($ 212.11) | Engulfing | Buy |
| 014 21 Jun 2023 | Buy Price: 206.67 | Profit: Open Day1 ($ 207.02) | Piercing Line | Buy |
| 015 15 Jun 2023 | Buy Price: 210.40 | Profit: Open Day1 ($ 211.35) | Engulfing | Buy |
| 016 14 Jun 2023 | Sell Price: 207.86 | Profit: Open Day1 ($ 207.44) | Dark Cloud Cover | Sell |
| 017 30 May 2023 | Sell Price: 202.79 | Profit: Open Day1 ($ 201.51) | Dark Cloud Cover | Sell |
| 018One Year Average | Both Sides Result for 17 Signals |
Loss: $ -1.31 ($ -0.08 / Signal) |
All of Them | Buy + Sell |
| Simple Moving Averages (SMA) Period | Value $ | Signal | Exponential Moving Averages (EMA) Period | Value $ | Signal | |
|---|---|---|---|---|---|---|
| 2 | 220.53 | SELL | 2 | 220.57 | SELL | |
| 3 | 220.81 | SELL | 3 | 220.78 | SELL | |
| 5 | 221.35 | SELL | 5 | 221.39 | SELL | |
| 8 | 221.92 | SELL | 8 | 222.56 | SELL | |
| 13 | 224.42 | SELL | 13 | 224.64 | SELL | |
| 21 | 228.68 | SELL | 21 | 227.35 | SELL | |
| 34 | 233.63 | SELL | 34 | 229.49 | SELL | |
| 55 | 234.69 | SELL | 55 | 229.35 | SELL | |
| 90 | 226.67 | SELL | 90 | 226.54 | SELL | |
| 200 | 216.82 | BUY | 200 | 220.61 | SELL |
Idex Corp
IPO: 1989-06-02
Ticker: IEXIndices: S&P 500,
Exchange: New York Stock Exchange, Inc. (US - USD)
Website: http://www.idexcorp.com
Phone:
Common Stock
Technology (
Pumps & Pumping Equipment

 Click to Enlarge