| Date | Price $ | Result % | Candle Name | Side |
|---|---|---|---|---|
| 001 22 Apr 2024 | Sell Price: 249.96 | Loss: Close Day2 ($ 251.76) | Dark Cloud Cover | Sell |
| 002 01 Apr 2024 | Sell Price: 265.23 | Profit: Close Day1 ($ 263.93) | Abandoned Baby | Sell |
| 003 22 Mar 2024 | Sell Price: 268.66 | Profit: Open Day1 ($ 267.95) | Engulfing | Sell |
| 004 18 Mar 2024 | Sell Price: 264.86 | Profit: Open Day1 ($ 263.82) | Dark Cloud Cover | Sell |
| 005 13 Mar 2024 | Sell Price: 262.67 | Loss: Close Day2 ($ 266.92) | Dark Cloud Cover | Sell |
| 006 29 Feb 2024 | Sell Price: 262.15 | Profit: Open Day1 ($ 261.74) | Dark Cloud Cover | Sell |
| 007 29 Dec 2023 | Buy Price: 261.94 | Loss: Close Day2 ($ 258.30) | Piercing Line | Buy |
| 008 18 Dec 2023 | Sell Price: 257.66 | Profit: Close Day2 ($ 256.69) | Dark Cloud Cover | Sell |
| 009 20 Nov 2023 | Sell Price: 239.62 | Loss: Close Day2 ($ 240.70) | Abandoned Baby | Sell |
| 010 20 Nov 2023 | Sell Price: 239.70 | Loss: Close Day2 ($ 240.70) | Engulfing | Sell |
| 011 29 Sep 2023 | Sell Price: 230.31 | Profit: Open Day1 ($ 229.82) | Dark Cloud Cover | Sell |
| 012 13 Sep 2023 | Buy Price: 237.91 | Profit: Open Day1 ($ 240.13) | Abandoned Baby | Buy |
| 013 13 Jul 2023 | Sell Price: 249.13 | Profit: Open Day1 ($ 248.91) | Abandoned Baby | Sell |
| 014 07 Jul 2023 | Buy Price: 243.81 | Profit: Open Day1 ($ 243.89) | Piercing Line | Buy |
| 015 21 Jun 2023 | Buy Price: 244.93 | Profit: Open Day1 ($ 245.70) | Piercing Line | Buy |
| 016 20 Jun 2023 | Sell Price: 244.06 | Profit: Open Day1 ($ 242.74) | Abandoned Baby | Sell |
| 017 12 May 2023 | Buy Price: 228.52 | Profit: Open Day1 ($ 229.30) | Abandoned Baby | Buy |
| 018One Year Average | Both Sides Result for 17 Signals |
Loss: $ -1.46 ($ -0.09 / Signal) |
All of Them | Buy + Sell |
| Simple Moving Averages (SMA) Period | Value $ | Signal | Exponential Moving Averages (EMA) Period | Value $ | Signal | |
|---|---|---|---|---|---|---|
| 2 | 242.96 | BUY | 2 | 243.42 | BUY | |
| 3 | 242.73 | BUY | 3 | 243.56 | BUY | |
| 5 | 244.31 | SELL | 5 | 244.35 | SELL | |
| 8 | 246.22 | SELL | 8 | 245.68 | SELL | |
| 13 | 247.63 | SELL | 13 | 247.82 | SELL | |
| 21 | 251.54 | SELL | 21 | 250.66 | SELL | |
| 34 | 257.18 | SELL | 34 | 253.48 | SELL | |
| 55 | 258.41 | SELL | 55 | 255.13 | SELL | |
| 90 | 258.09 | SELL | 90 | 254.68 | SELL | |
| 200 | 248.26 | SELL | 200 | 249.17 | SELL |
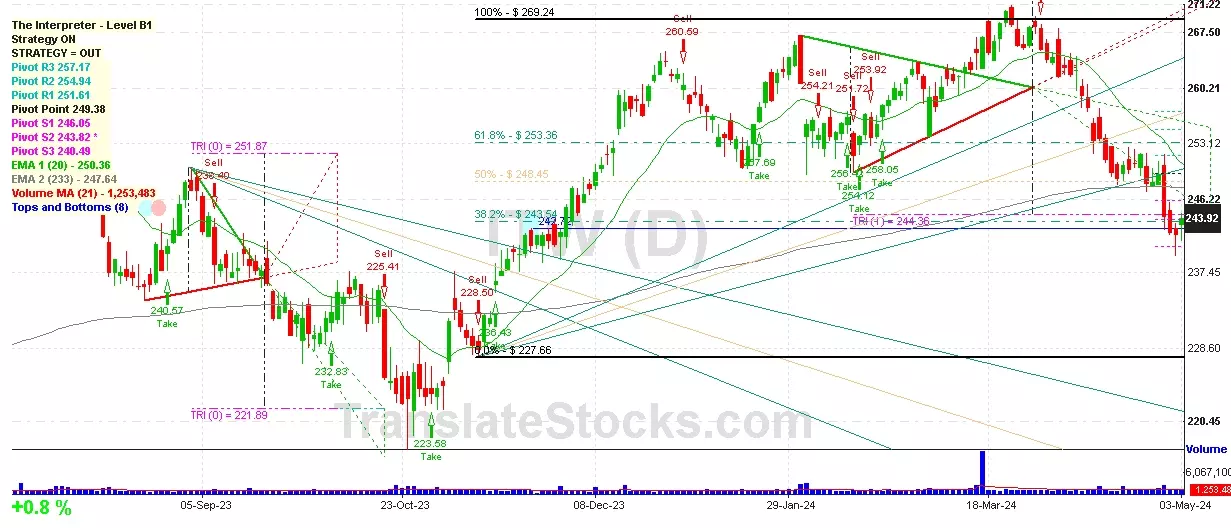
Illinois Tool Works
IPO: 1973-03-13
Ticker: ITWIndices: S&P 500,
Exchange: New York Stock Exchange, Inc. (US - USD)
Website: http://www.itw.com
Phone:
Common Stock
Technology (
General Industrial Machinery & Equipment

 Click to Enlarge