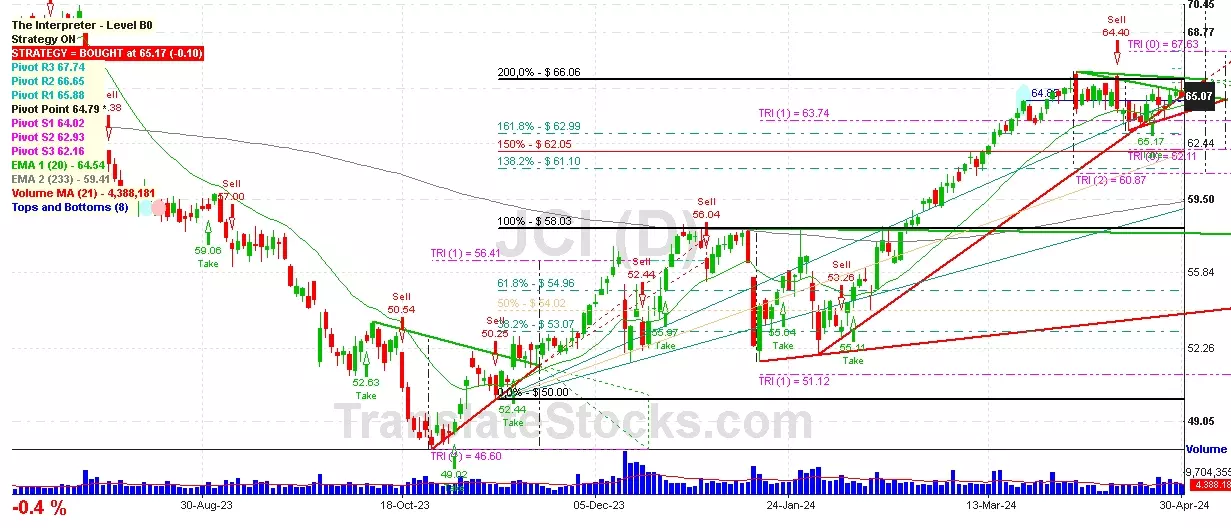
Hey Friend, I'm analysing JOHNSON CONTROLS INTERNATION (JCI), and it is between the Support of $ 64.79 (Pivot) and the Resistance of $ 65.88 (PivotR1). The stock is also approaching the line of Pivot at $ 64.79, and if it goes below this line it could reach the next Support of Triangle projection at $63.74.

| Date | Price $ | Result % | Candle Name | Side |
|---|---|---|---|---|
| 001 29 Feb 2024 | Sell Price: 59.27 | Profit: Open Day1 ($ 59.17) | Engulfing | Sell |
| 002 29 Feb 2024 | Sell Price: 59.36 | Profit: Open Day1 ($ 59.17) | Dark Cloud Cover | Sell |
| 003 24 Jan 2024 | Sell Price: 55.02 | Loss: Close Day2 ($ 56.59) | Engulfing | Sell |
| 004 24 Jan 2024 | Sell Price: 55.21 | Loss: Close Day2 ($ 56.59) | Dark Cloud Cover | Sell |
| 005 04 Jan 2024 | Buy Price: 56.72 | Profit: Close Day1 ($ 57.18) | Engulfing | Buy |
| 006 24 Nov 2023 | Sell Price: 52.40 | Profit: Open Day1 ($ 52.15) | Engulfing | Sell |
| 007 06 Oct 2023 | Buy Price: 52.35 | Profit: Close Day1 ($ 52.62) | Engulfing | Buy |
| 008 08 Sep 2023 | Buy Price: 57.35 | Profit: Open Day1 ($ 57.74) | Engulfing | Buy |
| 009 17 Aug 2023 | Sell Price: 59.16 | Profit: Open Day1 ($ 58.68) | Engulfing | Sell |
| 010 28 Jul 2023 | Sell Price: 69.19 | Loss: Close Day2 ($ 70.03) | Dark Cloud Cover | Sell |
| 011 26 Jun 2023 | Buy Price: 66.00 | Profit: Open Day1 ($ 66.20) | Abandoned Baby | Buy |
| 012 22 May 2023 | Sell Price: 63.00 | Profit: Open Day1 ($ 62.44) | Abandoned Baby | Sell |
| 013One Year Average | Both Sides Result for 12 Signals |
Loss: $ -0.90 ($ -0.08 / Signal) |
All of Them | Buy + Sell |
| Simple Moving Averages (SMA) Period | Value $ | Signal | Exponential Moving Averages (EMA) Period | Value $ | Signal | |
|---|---|---|---|---|---|---|
| 2 | 65.19 | SELL | 2 | 65.11 | SELL | |
| 3 | 65.16 | SELL | 3 | 65.07 | SELL | |
| 5 | 64.91 | BUY | 5 | 64.97 | BUY | |
| 8 | 64.75 | BUY | 8 | 64.86 | BUY | |
| 13 | 64.57 | BUY | 13 | 64.75 | BUY | |
| 21 | 64.81 | BUY | 21 | 64.50 | BUY | |
| 34 | 64.48 | BUY | 34 | 63.78 | BUY | |
| 55 | 62.35 | BUY | 55 | 62.46 | BUY | |
| 90 | 59.75 | BUY | 90 | 60.83 | BUY | |
| 200 | 57.81 | BUY | 200 | 59.35 | BUY |
Johnson Controls Internation
IPO: 1991-08-22
Ticker: JCIIndices: S&P 500,
Exchange: New York Stock Exchange, Inc. (IE - USD)
Website: https://www.johnsoncontrols.com/
Phone:
Common Stock
Trade & Services (
Services-miscellaneous Business Services
Year | 2021 | 2020 | 2019 | 2018 | 2017 | 2016 | 2015 | 2014 | 2013 | 2012 | 2011 | 2010 | 2009 | 2008 | 2007 | 2006 | |
|---|---|---|---|---|---|---|---|---|---|---|---|---|---|---|---|---|---|
| 1 | Assets + | 41,890 | 40,815 | 42,287 | 48,797 | 51,884 | 63,253 | 12,321 | 11,809 | 12,176 | 12,365 | 26,702 | 27,128 | 25,553 | 28,804 | 1,894 | 2,193 |
| 2 | Real Estate Investment Property + | 231 | 241 | 250 | 363 | 373 | 526 | 338 | 0 | 0 | 0 | 0 | 0 | 0 | 0 | 0 | 0 |
| 3 | Real Estate Investment Property + | 231 | 241 | 250 | 363 | 373 | 526 | 338 | 0 | 0 | 0 | 0 | 0 | 0 | 0 | 0 | 0 |
| 4 | Investments in and Advance to Affiliates + | 1,066 | 914 | 853 | 1,301 | 1,191 | 2,735 | 2,143 | 0 | 0 | 0 | 0 | 0 | 0 | 0 | 0 | 0 |
| 5 | Cash and Cash Equivalents + | 1,336 | 1,951 | 2,805 | 200 | 321 | 684 | 1,401 | 892 | 563 | 844 | 1,229 | 1,581 | 2,354 | 1,519 | 1,894 | 2,193 |
| 6 | Property + | 3,228 | 3,059 | 3,348 | 6,171 | 6,121 | 7,872 | 1,189 | 1,269 | 1,677 | 1,670 | 4,051 | 4,156 | 3,497 | 3,493 | 0 | 0 |
| 7 | Property + | 6,515 | 5,930 | 5,844 | 10,846 | 10,213 | 15,476 | 13,001 | 0 | 0 | 0 | 0 | 0 | 0 | 0 | 0 | 0 |
| 8 | Intangible Assets + | 5,549 | 5,356 | 5,632 | 6,348 | 6,741 | 7,653 | 871 | 737 | 804 | 771 | 3,628 | 3,446 | 2,647 | 2,681 | 0 | 0 |
| 9 | Finite-Lived Intangible Assets + | 3,137 | 3,028 | 3,260 | 3,778 | 4,115 | 4,948 | 974 | 440 | 505 | 470 | 3,330 | 3,141 | 2,344 | 0 | 0 | 0 |
| 10 | Liabilities and Equity + | 41,890 | 40,815 | 42,287 | 48,797 | 51,884 | 63,253 | 12,321 | 11,809 | 12,176 | 12,365 | 26,777 | 27,128 | 25,553 | 28,804 | 15,690 | 35,387 |
| 11 | Liabilities + | 23,145 | 22,313 | 21,468 | 27,654 | 31,520 | 39,048 | 8,245 | 7,126 | 7,043 | 7,343 | 12,497 | 13,027 | 12,599 | 13,296 | 0 | 0 |
| 12 | Debt and Lease Obligation + | 8 | 31 | 10 | 1,315 | 1,214 | 1,119 | 52 | 0 | 0 | 0 | 0 | 0 | 0 | 0 | 0 | 0 |
| 13 | Temporary Equity + | 0 | 0 | 0 | 0 | 211 | 234 | 212 | 13 | 12 | 12 | 93 | 0 | 0 | 0 | 0 | 0 |
| 14 | Redeemable Noncontrolling Interest + | 0 | 0 | 0 | 0 | 0 | 0 | 0 | 13 | 12 | 12 | 93 | 0 | 0 | 0 | 0 | 0 |
| 15 | Temporary Equity + | 0 | 0 | 0 | 0 | 211 | 234 | 212 | 0 | 0 | 0 | 0 | 0 | 0 | 0 | 0 | 0 |
| 16 | Stockholders' Equity + | 18,753 | 18,533 | 20,829 | 22,458 | 21,367 | 25,090 | 4,076 | 4,670 | 5,121 | 5,010 | 14,154 | 14,083 | 12,954 | 15,508 | 15,690 | 35,387 |
| 17 | Stockholders' Equity Attributable to Parent + | 17,562 | 17,447 | 19,766 | 21,164 | 20,447 | 24,118 | 4,041 | 4,647 | 5,098 | 4,994 | 14,182 | 14,084 | 12,941 | 15,494 | 15,624 | 35,387 |
| 18 | Stockholders' Equity + | 0.02 | 0.02 | 0.02 | 0.02 | 0.02 | 1.01 | 0.02 | 0 | 0 | 0 | 0 | 0 | 0 | 4.80 | 0 | 0 |
| 19 | Preferred Stock + | 0.01 | 0.01 | 0.01 | 0.01 | 0.01 | 0.01 | 0.01 | 0 | 0 | 0 | 0 | 0 | 0 | 4 | 0 | 0 |
| 20 | Common Stock + | 0.01 | 0.01 | 0.01 | 0.01 | 0.01 | 1 | 0.01 | 0 | 0 | 0 | 0 | 0 | 0 | 0.80 | 0 | 0 |
| 21 | Partners' Capital + | 2,025 | 2,469 | 4,827 | 6,604 | 5,231 | 9,177 | 5,165 | 4,873 | 3,035 | 2,499 | 2,058 | 312 | -820 | 1,125 | 0 | 0 |
| 22 | Partners' Capital + | 2,025 | 2,469 | 4,827 | 6,604 | 5,231 | 9,177 | 5,165 | 4,873 | 3,035 | 2,499 | 2,058 | 312 | -820 | 1,125 | 0 | 0 |
| 23 | Limited Liability Company (LLC) Members' Equity + | 1,591 | 1,693 | 4,032 | 5,658 | 4,758 | 8,024 | 3,324 | 3,648 | 2,048 | 1,533 | 1,624 | -9 | -907 | 1,357 | 0 | 0 |
| 24 | Limited Liability Company (LLC) Members' Equity + | 1,591 | 1,693 | 4,032 | 5,658 | 4,758 | 8,024 | 3,324 | 3,648 | 2,048 | 1,533 | 1,624 | -9 | -907 | 1,357 | 0 | 0 |
| 25 | Current Assets + | 9,998 | 10,053 | 12,393 | 11,823 | 12,292 | 17,109 | 4,653 | 4,751 | 4,067 | 4,353 | 6,433 | 7,353 | 7,967 | 8,429 | 0 | 0 |
| 26 | Cash + | 6 | 9 | 16 | 6 | 22 | 79 | 0 | 0 | 100 | 70 | 60 | 59 | 0 | 0 | 0 | 0 |
| 27 | Current Receivables + | 5,613 | 5,294 | 5,770 | 7,065 | 6,666 | 8,018 | 1,775 | 1,750 | 1,738 | 1,696 | 2,401 | 2,493 | 2,629 | 2,986 | 0 | 0 |
| 28 | Inventory + | 2,057 | 1,773 | 1,814 | 3,224 | 3,209 | 3,560 | 627 | 628 | 655 | 634 | 1,344 | 1,443 | 1,443 | 1,877 | 0 | 0 |
| 29 | Current Disposal Group + | 0 | 0 | 98 | 3,015 | 189 | 174 | 12 | 21 | 856 | 0 | 13,960 | 324 | 156 | 268 | 0 | 0 |
| 30 | Long-Term Assets + | 21,893 | 21,286 | 20,001 | 23,154 | 23,619 | 27,884 | 5,608 | 5,052 | 5,628 | 5,571 | 6,894 | 12,173 | 11,442 | 14,201 | 0 | 0 |
| 31 | Long-term Investments and Receivables + | 0 | 0 | 0 | 0 | 0 | 0 | 0 | 0 | 143 | 133 | 187 | 224 | 0 | 0 | 0 | 0 |
| 32 | Long-Term Restricted Cash and Investments + | 0 | 0 | 0 | 9 | 9 | 9 | 0 | 0 | 0 | 0 | 0 | 0 | 0 | 0 | 0 | 0 |
| 33 | Long-Term Disposal Group + | 156 | 147 | 60 | 5,188 | 1,920 | 7,374 | 1 | 3 | 0 | 0 | 0 | 0 | 0 | 0 | 0 | 0 |
| 34 | Current Liabilities + | 9,098 | 8,248 | 9,070 | 11,250 | 11,854 | 16,293 | 3,845 | 3,471 | 3,231 | 3,097 | 4,330 | 5,268 | 4,716 | 5,685 | 0 | 0 |
| 35 | Long-Term Other Undisclosed Liabilities | 0 | 0 | 0 | 0 | 0 | 0 | 0 | -152 | 3 | 300 | 936 | 868 | 913 | 1,187 | 0 | 0 |
| 36 | Long-Term Liabilities + | 14,039 | 14,034 | 12,388 | 15,089 | 18,452 | 21,636 | 8,466 | 3,655 | 3,812 | 4,246 | 8,167 | 7,759 | 7,883 | 7,611 | 0 | 0 |
| 37 | Increase (Decrease) in Stockholders' Equity [Roll Forward] + | -1,152 | -1,119 | -1,086 | -1,053 | -710 | -20 | -3 | -2,515 | -912 | -1,094 | -951 | -976 | -214 | -192 | 0 | 0 |
| 38 | Treasury Stock Transactions + | -1,152 | -1,119 | -1,086 | -1,053 | -710 | -20 | -3 | -2,515 | -912 | -1,094 | -951 | -976 | -214 | -192 | 0 | 0 |
| 39 | Treasury Stock + | -1,152 | -1,119 | -1,086 | -1,053 | -710 | -20 | -3 | -2,515 | -912 | -1,094 | -951 | -976 | -214 | -192 | 0 | 0 |
| 40 | Current Other Assets + | 992 | 1,035 | 1,906 | 1,334 | 1,907 | 2,639 | 406 | 683 | 473 | 524 | 508 | 936 | 972 | 1,238 | 0 | 0 |
| 41 | Total Current Assets + | 9,998 | 10,053 | 12,393 | 11,823 | 12,292 | 17,109 | 4,653 | 4,751 | 4,067 | 4,353 | 6,433 | 7,353 | 7,967 | 8,429 | 0 | 0 |
| 42 | Goodwill + | 18,335 | 17,932 | 18,178 | 19,473 | 19,688 | 23,409 | 4,236 | 4,126 | 4,519 | 4,367 | 4,228 | 9,577 | 8,791 | 11,619 | 0 | 0 |
| 43 | Long-Term Other Assets + | 3,558 | 3,354 | 1,823 | 3,681 | 3,931 | 4,475 | 1,372 | 926 | 1,109 | 1,204 | 2,666 | 2,596 | 2,651 | 2,582 | 0 | 0 |
| 44 | Total Assets + | 41,890 | 40,815 | 42,287 | 48,797 | 51,884 | 63,253 | 12,321 | 11,809 | 12,176 | 12,365 | 26,702 | 27,128 | 25,553 | 28,804 | 0 | 0 |
| 45 | Total Liabilities + | 0 | 0 | 0 | 0 | 0 | 0 | 8,245 | 7,126 | 7,043 | 7,343 | 12,497 | 13,027 | 12,599 | 13,296 | 0 | 0 |
| 46 | Stockholders' Equity Attributable to Noncontrolling Interest + | 1,191 | 1,086 | 1,063 | 1,294 | 920 | 972 | 35 | 23 | 23 | 16 | 5 | 17 | 13 | 0 | 0 | 0 |
| 47 | Total Stockholders' Equity + | 18,753 | 18,533 | 20,829 | 22,458 | 21,367 | 25,090 | 4,076 | 4,670 | 5,121 | 5,010 | 14,154 | 14,083 | 12,954 | 15,508 | 15,690 | 0 |
| 48 | Total Liabilities and Equity + | 41,890 | 40,815 | 42,287 | 48,797 | 51,884 | 63,253 | 12,321 | 11,809 | 12,176 | 12,365 | 26,777 | 27,128 | 25,553 | 28,804 | 0 | 0 |
Year | 2021 | 2020 | 2019 | 2018 | 2017 | 2016 | 2015 | 2014 | 2013 | 2012 | 2011 | 2010 | 2009 | 2008 | 2007 | |
|---|---|---|---|---|---|---|---|---|---|---|---|---|---|---|---|---|
| 1 | 0 | 0 | 0 | 0 | 0 | 0 | 9,902 | 10,340 | 10,647 | 10,403 | 10,557 | 17,016 | 17,237 | 20,199 | 18,477 | |
| 2 | -15,609 | -14,906 | -16,275 | -22,020 | -20,833 | -30,360 | -4,072 | -4,253 | -6,766 | -6,626 | -6,890 | -10,736 | -10,870 | -12,780 | 0 | |
| 3 | 8,059 | 7,411 | 7,693 | 9,380 | 9,339 | 7,314 | 6,447 | 6,305 | 0 | 0 | 1,780 | 1,669 | 1,581 | 0 | 0 | |
| 4 | 275 | 274 | 319 | 380 | 360 | 158 | 212 | 193 | 174 | 145 | 129 | 131 | 116 | 125 | 0 | |
| 5 | 0 | 0 | 0 | 0 | 0 | 0 | 0 | 0 | 0 | 0 | 0 | 0 | 1,133 | 1,154 | 1,148 | |
| 6 | 0 | 0 | 0 | 0 | 0 | 0 | 176 | 49 | 114 | 104 | 78 | 145 | 232 | 0 | 0 | |
| 7 | 0 | 0 | 0 | 0 | 0 | 0 | 5 | 3 | 4 | 9 | 5 | 0 | 0 | 0 | 0 | |
| 8 | -58 | -68 | -77 | -90 | -101 | -120 | 0 | 0 | 0 | 0 | 0 | 0 | 0 | 0 | 0 | |
| 9 | 5,258 | 5,665 | 6,244 | 6,010 | 6,158 | 5,325 | 2,573 | 3,040 | 2,930 | 2,903 | 2,834 | 4,586 | 4,657 | 4,906 | 4,776 | |
| 10 | -3 | 0 | 0 | 0 | 0 | 0 | 0 | 0 | 0 | 0 | 0 | 0 | 0 | 0 | 0 | |
| 11 | 0 | 0 | 0 | 114 | 9 | 26 | 1,340 | -111 | 0 | 0 | 0 | 0 | 0 | 0 | 0 | |
| 12 | 0 | 0 | 0 | 0 | 0 | 0 | 884 | 697 | 809 | 685 | 982 | 1,598 | -1,487 | 1,941 | -1,732 | |
| 13 | 0 | 0 | 0 | 0 | 0 | 0 | 10 | 215 | -42 | -11 | 1 | 11 | -9 | 13 | -10 | |
| 14 | 0 | 0 | 0 | 0 | 0 | 0 | -21 | 217 | -62 | -25 | 225 | 52 | 4 | 0 | -6 | |
| 15 | 193 | 82 | -3 | 27 | 42 | -11 | -24 | 18 | 0 | 0 | 0 | 0 | 0 | 0 | 0 | |
| 16 | 0 | 0 | 0 | 0 | 0 | 0 | 15 | 14 | 17 | 19 | 27 | 31 | 44 | 110 | 104 | |
| 17 | 56 | -32 | -10 | -5 | 94 | 95 | 119 | 8 | 0 | 0 | 0 | 0 | 0 | 0 | 0 | |
| 18 | 0 | 0 | 0 | 0 | 0 | 0 | -82 | -1 | -29 | -454 | -5 | -75 | -7 | -224 | -255 | |
| 19 | 219 | 240 | 335 | 437 | 466 | 309 | 102 | 97 | 100 | 209 | 240 | 284 | 301 | 396 | 313 | |
| 20 | 0 | 0 | 60 | 0 | 0 | 0 | 81 | 0 | 0 | 453 | 0 | 87 | 2 | -258 | -259 | |
| 21 | 0 | 0 | 0 | 0 | 0 | 0 | 715 | 613 | 697 | 41 | 764 | 1,270 | -1,770 | 1,389 | 0 | |
| 22 | 261 | 171 | 192 | 235 | 240 | 531 | 375 | 206 | -48 | -26 | -12 | 0 | 0 | 0 | 0 | |
| 23 | 2,614 | 903 | 1,056 | 2,901 | 2,558 | 1,586 | 2,151 | 1,916 | 0 | 0 | 0 | 0 | 0 | 0 | 0 | |
| 24 | -868 | -108 | 233 | -518 | -705 | -2,238 | -100 | -24 | -125 | -348 | -134 | -138 | -78 | -335 | -324 | |
| 25 | 878 | 687 | 1,522 | 1,865 | 1,148 | -2,890 | 515 | 771 | 399 | -681 | 484 | 994 | -1,919 | 728 | 0 | |
| 26 | 0 | 0 | 0 | 0 | 0 | 0 | -13 | 58 | 101 | 1,208 | 1,145 | 28 | 23 | 94 | 0 | |
| 27 | 0 | 0 | 0 | 0 | 0 | 0 | -27 | 1,160 | 0 | 4 | 170 | -5 | 33 | 484 | 0 | |
| 28 | 0 | 0 | 0 | 0 | 0 | 0 | -26 | -173 | 1 | -130 | -189 | -16 | -9 | -87 | 0 | |
| 29 | 124 | 0 | 4,598 | 1,034 | -34 | -1,516 | 128 | -166 | 0 | 804 | 168 | 7 | 47 | 491 | 0 | |
| 30 | 1,870 | 795 | 5,887 | 2,383 | 1,819 | -652 | 549 | 1,839 | 533 | 471 | 1,720 | 1,139 | -1,794 | 1,554 | 0 | |
| 31 | 0 | 0 | 0 | 0 | 0 | 0 | 2 | -1 | 3 | 1 | -1 | -7 | -4 | -1 | 0 | |
| 32 | Total Net Income (Loss) Attributable to Parent + | 1,637 | 631 | 5,674 | 2,162 | 1,611 | -868 | 551 | 1,838 | 536 | 472 | 1,719 | 1,132 | -1,798 | 1,553 | -1,742 |
| 33 | Income (Loss) from Continuing Operations + | 1,746 | 795 | 1,289 | 2,383 | 1,853 | -652 | 615 | 795 | 524 | -333 | 618 | 1,132 | -1,841 | 1,063 | 0 |
| 34 | Income (Loss) from Continuing Operations + | 1,979 | 959 | 1,478 | 2,604 | 2,052 | -436 | 727 | 900 | 0 | 0 | 0 | 0 | 0 | 0 | 0 |
| 35 | Total Income (Loss) from Continuing Operations + | 3,492 | 1,590 | 2,578 | 4,766 | 3,706 | -1,304 | 1,344 | 1,694 | 1,051 | -665 | 1,235 | 2,257 | -3,674 | 2,158 | -2,524 |
| 36 | Income (Loss) from Discontinued Operations + | 124 | 0 | 4,598 | 1,034 | -34 | -1,516 | 128 | -166 | 0 | 804 | 168 | 7 | 47 | 491 | 0 |
| 37 | Income (Loss) from Discontinued Operations + | 0 | 0 | 4,622 | 1,081 | -25 | -1,432 | 132 | -143 | 0 | 0 | 0 | 0 | 0 | 0 | 0 |
| 38 | Total Income (Loss) from Discontinued Operations + | 124 | 0 | 4,574 | 987 | -43 | -1,600 | -66 | 1,044 | 9 | 804 | 1,102 | 7 | 35 | 458 | 782 |
| 39 | Income (Loss) from Continuing Operations + | 2.11 | 0.84 | 1.26 | 2.34 | 1.77 | -1.30 | 1.47 | 1.74 | 1.14 | -0.72 | 1.30 | 2.32 | -3.87 | 2.26 | -5.10 |
| 40 | 0.17 | 0 | 5.26 | 1.07 | -0.05 | -2.40 | 0.19 | -0.28 | 0 | 0 | 0 | 0 | 0 | 0 | 0 | |
| 41 | 0 | 0 | 0 | 0 | 0 | 0 | 0.03 | 2.02 | 0.01 | 1.74 | 2.33 | 0.01 | 0.07 | 0.95 | 1.58 | |
| 42 | Total Earnings Per Share + | 2.28 | 0.84 | 6.52 | 2.34 | 1.72 | -1.30 | 1.31 | 4.04 | 1.15 | 1.02 | 3.63 | 2.33 | -3.80 | 3.21 | -3.52 |
| 43 | Income (Loss) from Continuing Operations + | 2.11 | 0.84 | 1.26 | 2.34 | 1.77 | -1.30 | 1.47 | 1.74 | 1.14 | -0.72 | 1.30 | 2.32 | -3.87 | 2.26 | -5.10 |
| 44 | Income (Loss) from Continuing Operations + | 2.10 | 0.84 | 1.26 | 2.32 | 1.75 | -1.30 | 1.44 | 1.71 | 1.12 | -0.72 | 1.29 | 2.31 | -3.87 | 2.25 | -5.10 |
| 45 | 0.17 | 0 | 5.23 | 1.06 | -0.05 | -2.38 | 0.19 | -0.28 | 0 | 0 | 0 | 0 | 0 | 0 | 0 | |
| 46 | 0 | 0 | 0 | 0 | 0 | 0 | 0.04 | 1.98 | 0.02 | 1.74 | 2.30 | 0.01 | 0.07 | 0.94 | 1.58 | |
| 47 | Total Earnings Per Share + | 2.27 | 0.84 | 6.49 | 2.32 | 1.71 | -1.30 | 1.29 | 3.97 | 1.14 | 1.02 | 3.59 | 2.32 | -3.80 | 3.19 | -3.52 |
| 48 | 1.07 | 1.04 | 1.04 | 1.04 | 1 | 1.16 | 1.04 | 0.88 | 0 | 0 | 0 | 0 | 0 | 0 | 0 |
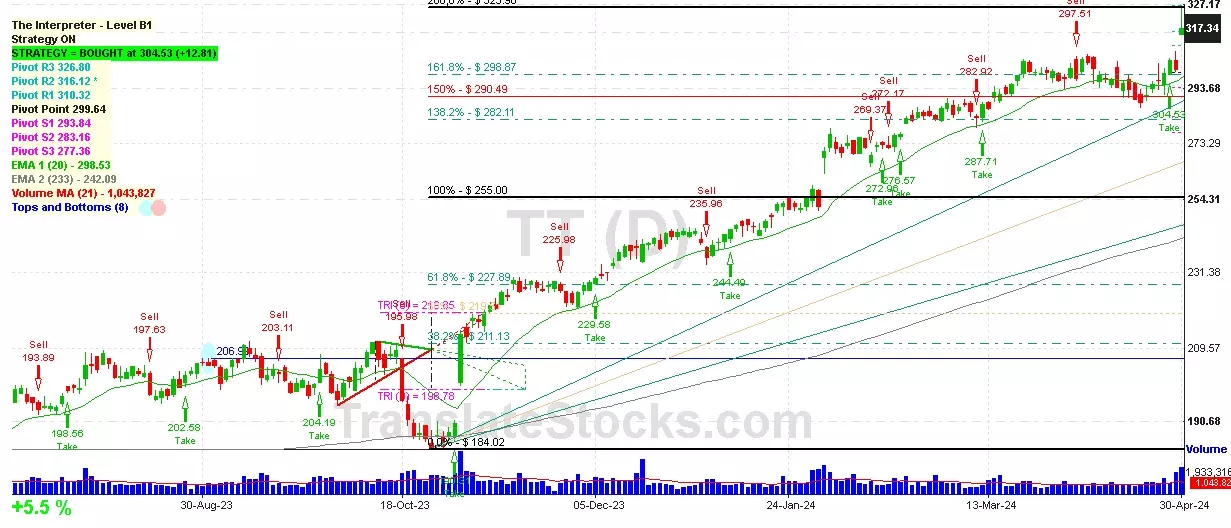
 Click to Enlarge
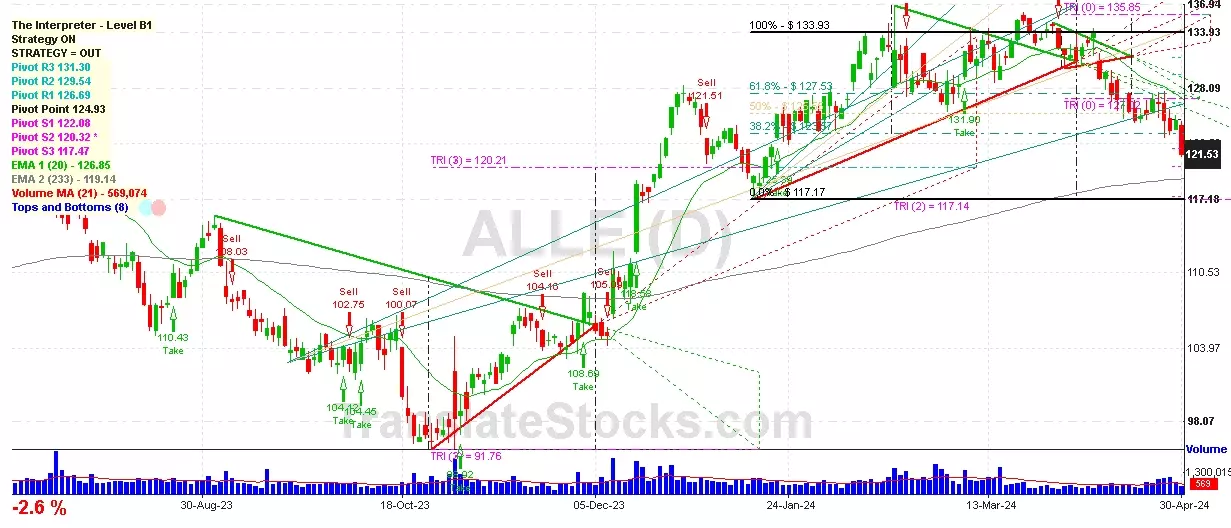