| Date | Price $ | Result % | Candle Name | Side |
|---|---|---|---|---|
| 001 17 Apr 2024 | Buy Price: 25.15 | Profit: Close Day1 ($ 25.46) | Abandoned Baby | Buy |
| 002 12 Apr 2024 | Sell Price: 25.39 | Profit: Open Day2 ($ 25.04) | Abandoned Baby | Sell |
| 003 27 Mar 2024 | Buy Price: 27.23 | Profit: Open Day1 ($ 27.50) | Engulfing | Buy |
| 004 26 Mar 2024 | Sell Price: 26.36 | Profit: Open Day1 ($ 26.28) | Engulfing | Sell |
| 005 15 Mar 2024 | Buy Price: 27.45 | Profit: Close Day1 ($ 27.85) | Engulfing | Buy |
| 006 08 Mar 2024 | Buy Price: 24.75 | Profit: Open Day1 ($ 25.60) | Engulfing | Buy |
| 007 06 Mar 2024 | Buy Price: 24.91 | Loss: Close Day2 ($ 24.75) | Abandoned Baby | Buy |
| 008 20 Feb 2024 | Sell Price: 23.23 | Loss: Close Day2 ($ 23.96) | Abandoned Baby | Sell |
| 009 07 Feb 2024 | Sell Price: 23.05 | Profit: Open Day1 ($ 22.62) | Abandoned Baby | Sell |
| 010 05 Feb 2024 | Buy Price: 22.39 | Profit: Open Day1 ($ 23.73) | Abandoned Baby | Buy |
| 011 26 Jan 2024 | Sell Price: 23.86 | Profit: Close Day1 ($ 23.46) | Abandoned Baby | Sell |
| 012 19 Jan 2024 | Buy Price: 22.29 | Profit: Open Day2 ($ 22.96) | Piercing Line | Buy |
| 013 02 Jan 2024 | Sell Price: 27.20 | Profit: Open Day1 ($ 26.95) | Abandoned Baby | Sell |
| 014 18 Dec 2023 | Sell Price: 26.64 | Profit: Close Day2 ($ 26.43) | Abandoned Baby | Sell |
| 015 08 Dec 2023 | Sell Price: 26.45 | Profit: Open Day1 ($ 25.30) | Abandoned Baby | Sell |
| 016 06 Dec 2023 | Buy Price: 26.60 | Profit: Open Day1 ($ 26.80) | Abandoned Baby | Buy |
| 017 16 Nov 2023 | Sell Price: 28.08 | Profit: Open Day1 ($ 27.65) | Abandoned Baby | Sell |
| 018 07 Nov 2023 | Sell Price: 26.82 | Profit: Open Day1 ($ 26.56) | Abandoned Baby | Sell |
| 019 27 Oct 2023 | Sell Price: 25.65 | Profit: Open Day2 ($ 25.46) | Dark Cloud Cover | Sell |
| 020 23 Oct 2023 | Buy Price: 24.80 | Profit: Close Day1 ($ 25.25) | Engulfing | Buy |
| 021 12 Oct 2023 | Sell Price: 27.83 | Profit: Open Day1 ($ 26.48) | Abandoned Baby | Sell |
| 022 29 Sep 2023 | Buy Price: 29.13 | Profit: Open Day1 ($ 29.25) | Abandoned Baby | Buy |
| 023 22 Sep 2023 | Buy Price: 30.41 | Loss: Close Day2 ($ 29.03) | Abandoned Baby | Buy |
| 024 14 Sep 2023 | Buy Price: 31.72 | Profit: Open Day1 ($ 31.78) | Abandoned Baby | Buy |
| 025 01 Sep 2023 | Buy Price: 34.10 | Profit: Close Day1 ($ 34.26) | Abandoned Baby | Buy |
| 026 30 Aug 2023 | Sell Price: 33.97 | Profit: Open Day1 ($ 33.14) | Abandoned Baby | Sell |
| 027 24 Aug 2023 | Sell Price: 33.02 | Profit: Close Day1 ($ 32.96) | Engulfing | Sell |
| 028 11 Aug 2023 | Sell Price: 36.46 | Profit: Open Day1 ($ 36.40) | Abandoned Baby | Sell |
| 029 04 Aug 2023 | Sell Price: 39.09 | Profit: Close Day1 ($ 38.91) | Engulfing | Sell |
| 030 03 Aug 2023 | Buy Price: 39.56 | Profit: Open Day1 ($ 39.88) | Abandoned Baby | Buy |
| 031 01 Aug 2023 | Sell Price: 40.04 | Profit: Open Day1 ($ 39.01) | Abandoned Baby | Sell |
| 032 14 Jul 2023 | Sell Price: 38.14 | Profit: Open Day1 ($ 37.22) | Abandoned Baby | Sell |
| 033 07 Jul 2023 | Buy Price: 35.76 | Profit: Close Day1 ($ 35.95) | Abandoned Baby | Buy |
| 034 06 Jul 2023 | Sell Price: 34.08 | Loss: Close Day2 ($ 35.95) | Abandoned Baby | Sell |
| 035 30 Jun 2023 | Buy Price: 34.13 | Profit: Open Day1 ($ 35.10) | Abandoned Baby | Buy |
| 036 22 May 2023 | Buy Price: 35.99 | Loss: Close Day2 ($ 33.88) | Abandoned Baby | Buy |
| 037One Year Average | Both Sides Result for 36 Signals |
Profit: $ 8.24 ($ 0.23 / Signal) |
All of Them | Buy + Sell |
| Simple Moving Averages (SMA) Period | Value $ | Signal | Exponential Moving Averages (EMA) Period | Value $ | Signal | |
|---|---|---|---|---|---|---|
| 2 | 30.96 | BUY | 2 | 31.51 | BUY | |
| 3 | 30.27 | BUY | 3 | 30.94 | BUY | |
| 5 | 30.21 | BUY | 5 | 30.25 | BUY | |
| 8 | 29.43 | BUY | 8 | 29.52 | BUY | |
| 13 | 27.97 | BUY | 13 | 28.73 | BUY | |
| 21 | 27.28 | BUY | 21 | 28.00 | BUY | |
| 34 | 27.30 | BUY | 34 | 27.30 | BUY | |
| 55 | 26.10 | BUY | 55 | 26.70 | BUY | |
| 90 | 25.44 | BUY | 90 | 26.58 | BUY | |
| 200 | 28.25 | BUY | 200 | 29.30 | BUY |
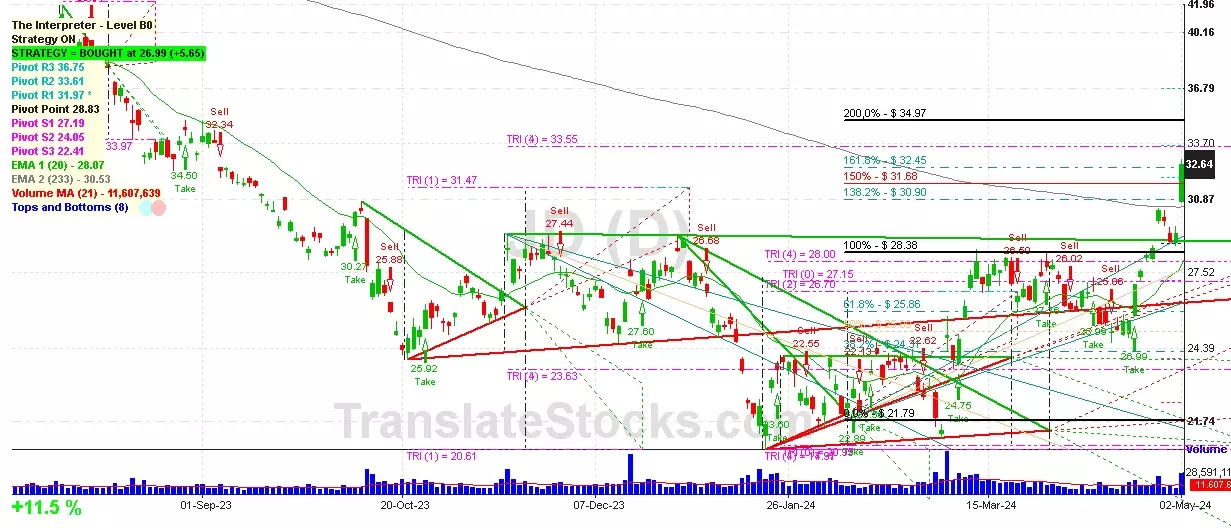
Jd.com Inc-adr
IPO: 2014-05-22
Ticker: JDIndices: Nasdaq 100,
Exchange: Hong Kong Exchanges And Clearing Ltd (CN - USD)
Website: https://www.jd.com/
Phone:
ADR
Trade & Services (
Retail-retail Stores, Nec

 Click to Enlarge