| Date | Price $ | Result % | Candle Name | Side |
|---|---|---|---|---|
| 001 03 Apr 2024 | Buy Price: 697.53 | Profit: Open Day1 ($ 706.28) | Engulfing | Buy |
| 002 05 Mar 2024 | Sell Price: 705.87 | Loss: Close Day2 ($ 723.26) | Abandoned Baby | Sell |
| 003 18 Dec 2023 | Sell Price: 576.73 | Profit: Open Day2 ($ 572.05) | Engulfing | Sell |
| 004 18 Aug 2023 | Buy Price: 477.96 | Profit: Open Day1 ($ 478.73) | Engulfing | Buy |
| 005 18 Aug 2023 | Buy Price: 477.63 | Profit: Open Day1 ($ 478.73) | Piercing Line | Buy |
| 006 02 Aug 2023 | Sell Price: 499.57 | Profit: Open Day1 ($ 497.27) | Abandoned Baby | Sell |
| 007One Year Average | Both Sides Result for 6 Signals |
Profit: $ 0.21 ($ 0.04 / Signal) |
All of Them | Buy + Sell |
| Simple Moving Averages (SMA) Period | Value $ | Signal | Exponential Moving Averages (EMA) Period | Value $ | Signal | |
|---|---|---|---|---|---|---|
| 2 | 674.05 | BUY | 2 | 679.95 | BUY | |
| 3 | 679.13 | BUY | 3 | 681.06 | BUY | |
| 5 | 691.51 | SELL | 5 | 681.14 | BUY | |
| 8 | 679.41 | BUY | 8 | 679.08 | BUY | |
| 13 | 668.74 | BUY | 13 | 677.47 | BUY | |
| 21 | 675.42 | BUY | 21 | 677.87 | BUY | |
| 34 | 683.68 | SELL | 34 | 677.04 | BUY | |
| 55 | 684.17 | SELL | 55 | 668.34 | BUY | |
| 90 | 648.82 | BUY | 90 | 646.22 | BUY | |
| 200 | 566.39 | BUY | 200 | 582.85 | BUY |
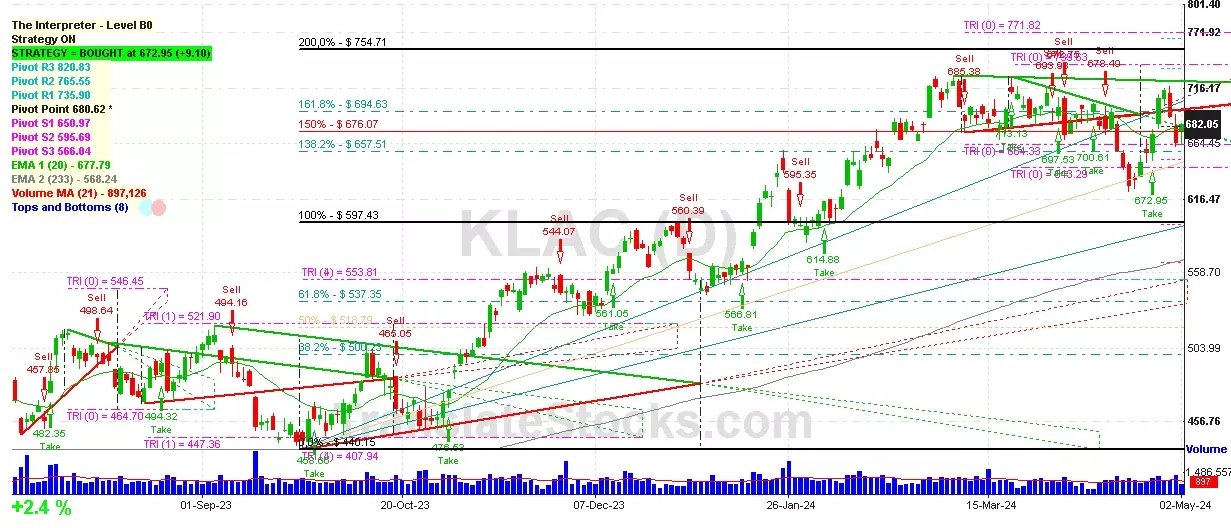
Kla Corp
IPO: 1980-10-08
Ticker: KLACIndices: S&P 500,
Nasdaq 100,
Exchange: Nasdaq Nms - Global Market (US - USD)
Website: https://www.kla-tencor.com/
Phone:
Common Stock
Life Sciences (
Optical Instruments & Lenses

 Click to Enlarge