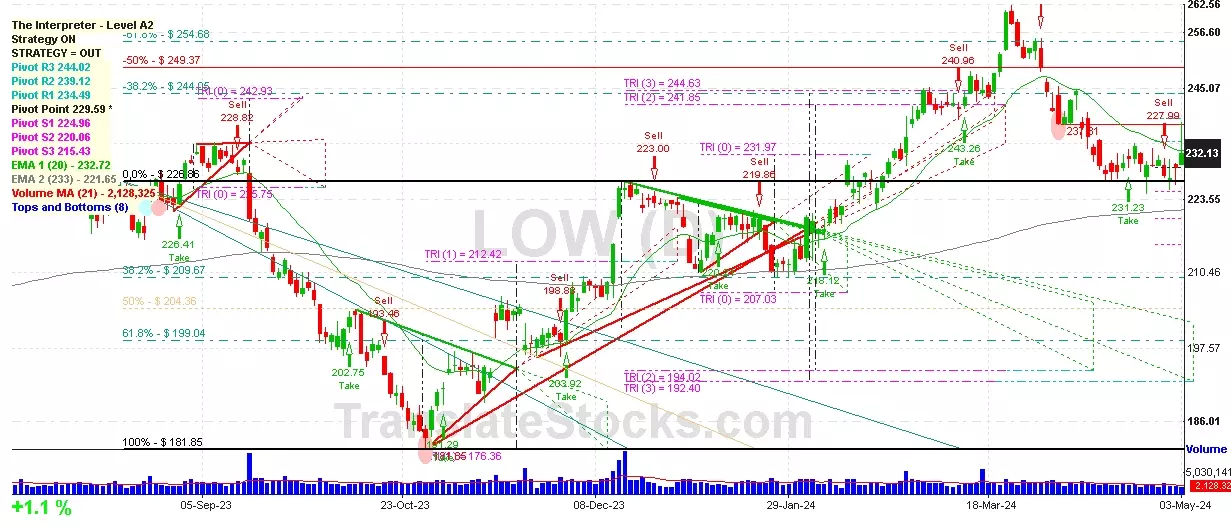
Hey Friend, I'm analysing LOWE'S COS INC (LOW), and it is between the Support of $ 231.97 (Triangle Projection Level 0) and the Resistance of $ 234.49 (PivotR1). The stock is also approaching the line of PivotR1 at $ 234.49, and if it goes above this line it could reach the next Resistance of Triangle projection at $241.85.

| Date | Price $ | Result % | Candle Name | Side |
|---|---|---|---|---|
| 001 30 Apr 2024 | Sell Price: 227.99 | Profit: Open Day1 ($ 227.37) | Abandoned Baby | Sell |
| 002 30 Apr 2024 | Sell Price: 228.23 | Profit: Open Day1 ($ 227.37) | Engulfing | Sell |
| 003 26 Feb 2024 | Sell Price: 231.32 | Loss: Close Day2 ($ 238.80) | Engulfing | Sell |
| 004 21 Feb 2024 | Buy Price: 227.79 | Profit: Open Day1 ($ 228.32) | Abandoned Baby | Buy |
| 005 06 Nov 2023 | Sell Price: 194.23 | Loss: Close Day2 ($ 194.68) | Abandoned Baby | Sell |
| 006 05 Sep 2023 | Sell Price: 230.43 | Profit: Open Day1 ($ 230.24) | Engulfing | Sell |
| 007 15 Aug 2023 | Sell Price: 223.84 | Profit: Close Day1 ($ 222.15) | Abandoned Baby | Sell |
| 008 25 Jul 2023 | Sell Price: 233.94 | Profit: Open Day1 ($ 233.70) | Abandoned Baby | Sell |
| 009 05 Jul 2023 | Buy Price: 225.49 | Loss: Close Day2 ($ 221.94) | Engulfing | Buy |
| 010One Year Average | Both Sides Result for 9 Signals |
Loss: $ -7.35 ($ -0.82 / Signal) |
All of Them | Buy + Sell |
| Simple Moving Averages (SMA) Period | Value $ | Signal | Exponential Moving Averages (EMA) Period | Value $ | Signal | |
|---|---|---|---|---|---|---|
| 2 | 230.86 | BUY | 2 | 231.10 | BUY | |
| 3 | 229.74 | BUY | 3 | 230.56 | BUY | |
| 5 | 229.63 | BUY | 5 | 230.17 | BUY | |
| 8 | 229.79 | BUY | 8 | 230.24 | BUY | |
| 13 | 230.07 | BUY | 13 | 231.11 | BUY | |
| 21 | 232.39 | SELL | 21 | 232.92 | SELL | |
| 34 | 239.09 | SELL | 34 | 234.44 | SELL | |
| 55 | 238.55 | SELL | 55 | 233.84 | SELL | |
| 90 | 230.74 | BUY | 90 | 230.61 | BUY | |
| 200 | 220.44 | BUY | 200 | 222.94 | BUY |
Lowe's Cos Inc
IPO: 1979-12-19
Ticker: LOWIndices: S&P 500,
Exchange: New York Stock Exchange, Inc. (US - USD)
Website: http://www.lowes.com/
Phone:
Common Stock
Trade & Services (
Retail-lumber & Other Building Materials Dealers
 Click to Enlarge