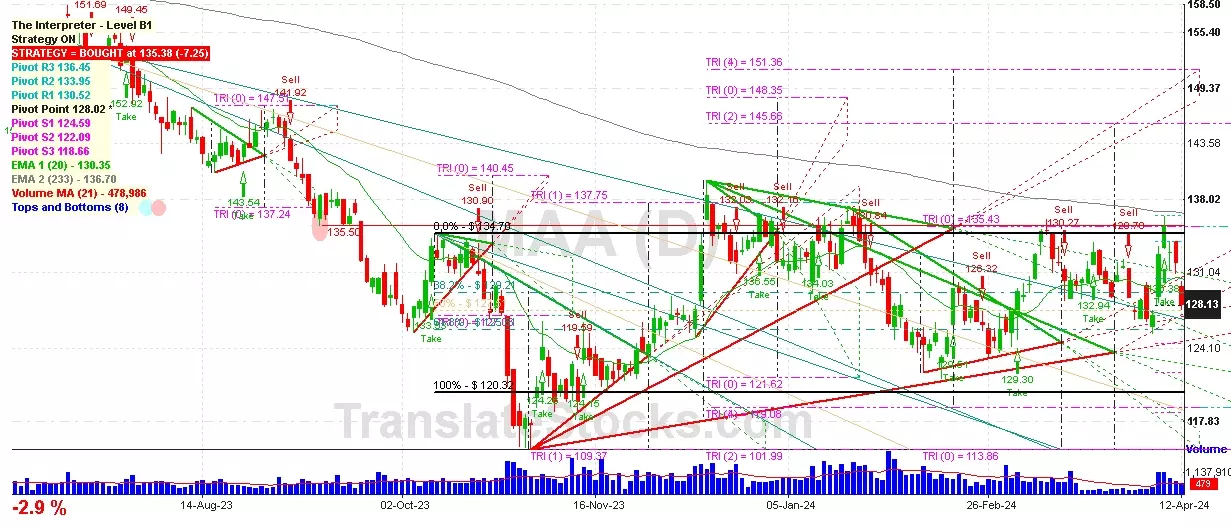
Hey Friend, I'm analysing MID AMERICA APARTMENT COMM (MAA), and it is between the Support of $ 128.02 (Pivot) and the Resistance of $ 129.21 (38.2% of Fibonacci). The stock is also approaching the line of Pivot at $ 128.02, and if it goes below this line it could reach the next Support of 50% of Fibonacci at $ 127.51.

| Date | Price $ | Result % | Candle Name | Side |
|---|---|---|---|---|
| 001 10 Apr 2024 | Sell Price: 132.95 | Profit: Close Day1 ($ 131.99) | Abandoned Baby | Sell |
| 002 04 Apr 2024 | Sell Price: 126.83 | Profit: Open Day1 ($ 126.33) | Engulfing | Sell |
| 003 04 Apr 2024 | Sell Price: 127.39 | Profit: Open Day1 ($ 126.33) | Dark Cloud Cover | Sell |
| 004 01 Apr 2024 | Sell Price: 128.70 | Profit: Open Day1 ($ 127.58) | Abandoned Baby | Sell |
| 005 12 Oct 2023 | Sell Price: 131.72 | Profit: Close Day1 ($ 131.42) | Abandoned Baby | Sell |
| 006 16 Aug 2023 | Buy Price: 142.41 | Profit: Open Day1 ($ 142.45) | Abandoned Baby | Buy |
| 007 10 Aug 2023 | Sell Price: 144.19 | Profit: Open Day1 ($ 144.04) | Engulfing | Sell |
| 008 26 Jun 2023 | Buy Price: 149.70 | Profit: Open Day1 ($ 150.08) | Engulfing | Buy |
| 009 13 Jun 2023 | Buy Price: 153.68 | Profit: Open Day1 ($ 154.35) | Piercing Line | Buy |
| 010One Year Average | Both Sides Result for 9 Signals |
Profit: $ 5.18 ($ 0.58 / Signal) |
All of Them | Buy + Sell |
| Simple Moving Averages (SMA) Period | Value $ | Signal | Exponential Moving Averages (EMA) Period | Value $ | Signal | |
|---|---|---|---|---|---|---|
| 2 | 128.22 | BUY | 2 | 128.65 | BUY | |
| 3 | 128.28 | BUY | 3 | 128.34 | BUY | |
| 5 | 127.96 | BUY | 5 | 127.94 | BUY | |
| 8 | 126.91 | BUY | 8 | 127.74 | BUY | |
| 13 | 127.60 | BUY | 13 | 127.88 | BUY | |
| 21 | 128.43 | BUY | 21 | 128.24 | BUY | |
| 34 | 129.46 | SELL | 34 | 128.62 | BUY | |
| 55 | 128.62 | BUY | 55 | 128.93 | BUY | |
| 90 | 130.02 | SELL | 90 | 129.56 | SELL | |
| 200 | 132.63 | SELL | 200 | 134.04 | SELL |
Mid-america Apartment Comm
IPO: 1994-01-28
Ticker: MAAIndices: S&P 500,
Exchange: New York Stock Exchange, Inc. (US - USD)
Website: http://www.maac.com
Phone:
REIT (Real Estate Investment Trust)
Real Estate & Construction (
Real Estate Investment Trusts
 Click to Enlarge