| Date | Price $ | Result % | Candle Name | Side |
|---|---|---|---|---|
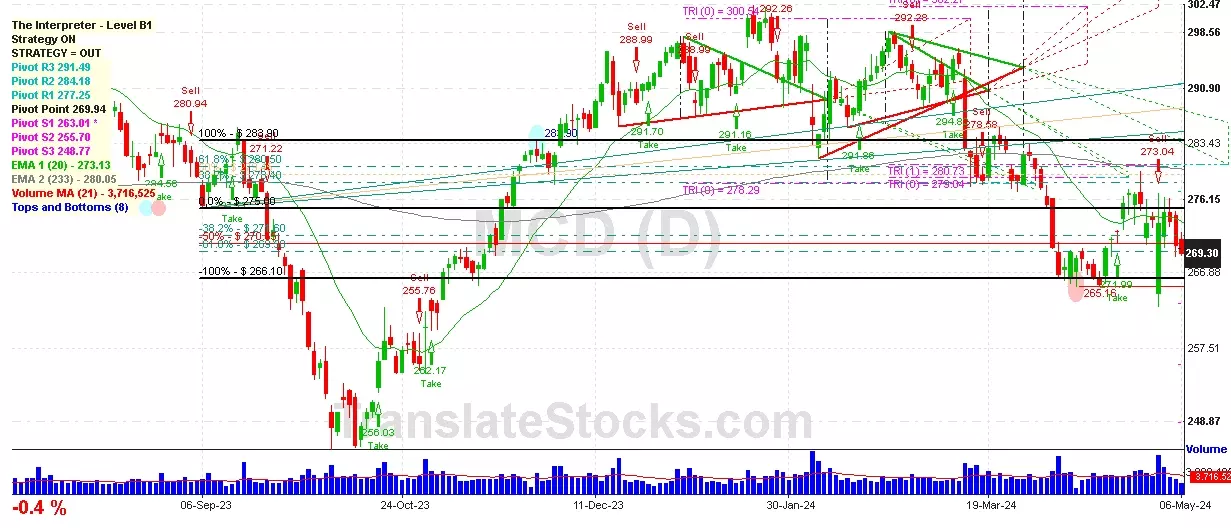
| 001 24 Apr 2024 | Sell Price: 276.75 | Profit: Close Day1 ($ 275.60) | Abandoned Baby | Sell |
| 002 08 Mar 2024 | Buy Price: 292.55 | Profit: Close Day1 ($ 294.82) | Piercing Line | Buy |
| 003 08 Jan 2024 | Buy Price: 291.90 | Profit: Close Day2 ($ 294.09) | Engulfing | Buy |
| 004 19 Sep 2023 | Buy Price: 278.13 | Profit: Open Day1 ($ 278.74) | Piercing Line | Buy |
| 005 20 Jun 2023 | Sell Price: 293.04 | Loss: Close Day2 ($ 293.30) | Abandoned Baby | Sell |
| 006One Year Average | Both Sides Result for 5 Signals |
Profit: $ 5.96 ($ 1.19 / Signal) |
All of Them | Buy + Sell |
| Simple Moving Averages (SMA) Period | Value $ | Signal | Exponential Moving Averages (EMA) Period | Value $ | Signal | |
|---|---|---|---|---|---|---|
| 2 | 269.81 | SELL | 2 | 269.99 | SELL | |
| 3 | 270.97 | SELL | 3 | 270.63 | SELL | |
| 5 | 272.07 | SELL | 5 | 271.49 | SELL | |
| 8 | 272.83 | SELL | 8 | 272.08 | SELL | |
| 13 | 273.45 | SELL | 13 | 272.46 | SELL | |
| 21 | 271.34 | SELL | 21 | 273.26 | SELL | |
| 34 | 274.21 | SELL | 34 | 275.27 | SELL | |
| 55 | 280.65 | SELL | 55 | 278.05 | SELL | |
| 90 | 285.51 | SELL | 90 | 280.23 | SELL | |
| 200 | 280.45 | SELL | 200 | 280.56 | SELL |
Mcdonald's Corp
IPO: 1966-07-05
Website: https://www.mcdonalds.com/us/en-us.html
Phone:
Common Stock
Trade & Services (
Retail-eating Places

 Click to Enlarge