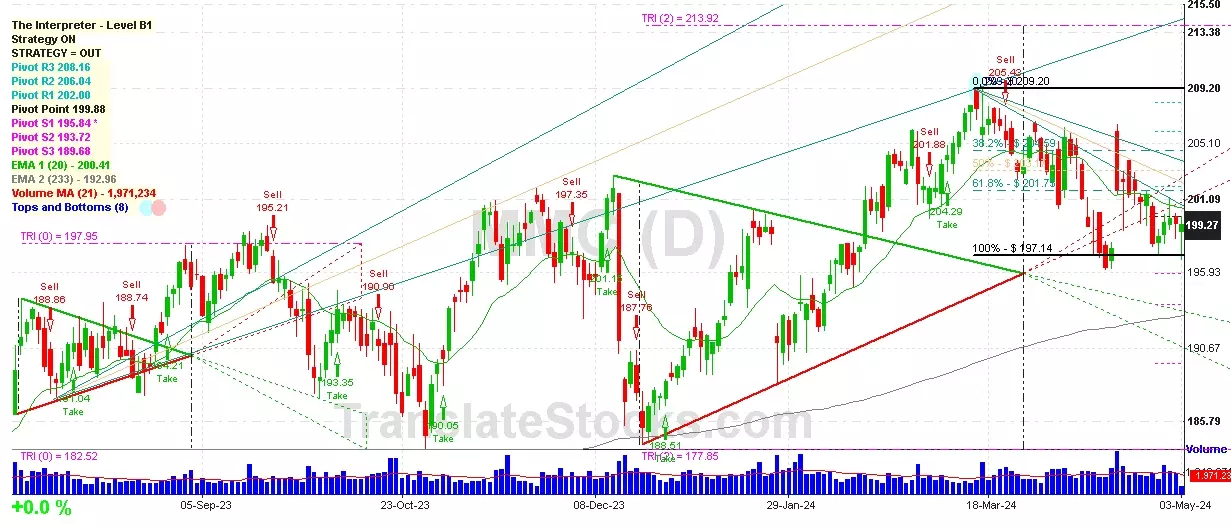
Hey Friend, I'm analysing MARSH & MCLENNAN COS (MMC), and it is between the Support of $ 197.95 (Triangle Projection Level 0) and the Resistance of $ 199.88 (Pivot). The stock is also approaching the line of Pivot at $ 199.88, and if it goes above this line it could reach the next Resistance of 61.8% of Fibonacci at $ 201.75.

| Date | Price $ | Result % | Candle Name | Side |
|---|---|---|---|---|
| 001 25 Apr 2024 | Buy Price: 201.47 | Loss: Close Day2 ($ 198.48) | Engulfing | Buy |
| 002 25 Apr 2024 | Buy Price: 201.31 | Loss: Close Day2 ($ 198.48) | Piercing Line | Buy |
| 003 03 Apr 2024 | Buy Price: 203.50 | Profit: Open Day1 ($ 204.72) | Piercing Line | Buy |
| 004 01 Apr 2024 | Sell Price: 203.89 | Profit: Close Day1 ($ 203.08) | Abandoned Baby | Sell |
| 005 14 Mar 2024 | Sell Price: 207.74 | Profit: Open Day1 ($ 205.80) | Dark Cloud Cover | Sell |
| 006 12 Feb 2024 | Sell Price: 196.19 | Loss: Close Day2 ($ 197.72) | Engulfing | Sell |
| 007 26 Jan 2024 | Buy Price: 192.99 | Profit: Close Day2 ($ 193.03) | Engulfing | Buy |
| 008 04 Oct 2023 | Buy Price: 191.12 | Profit: Close Day1 ($ 191.92) | Abandoned Baby | Buy |
| 009 29 Sep 2023 | Sell Price: 190.30 | Profit: Open Day1 ($ 189.41) | Engulfing | Sell |
| 010 20 Sep 2023 | Sell Price: 197.47 | Profit: Open Day1 ($ 197.04) | Engulfing | Sell |
| 011 04 Aug 2023 | Sell Price: 189.59 | Profit: Close Day2 ($ 189.41) | Engulfing | Sell |
| 012 03 Jul 2023 | Sell Price: 185.42 | Profit: Open Day1 ($ 184.68) | Abandoned Baby | Sell |
| 013 20 Jun 2023 | Sell Price: 181.05 | Profit: Open Day1 ($ 180.68) | Abandoned Baby | Sell |
| 014 13 Jun 2023 | Sell Price: 177.37 | Loss: Close Day2 ($ 180.53) | Abandoned Baby | Sell |
| 015 08 Jun 2023 | Buy Price: 176.31 | Profit: Close Day1 ($ 178.25) | Abandoned Baby | Buy |
| 016 09 May 2023 | Sell Price: 179.38 | Loss: Close Day2 ($ 180.37) | Engulfing | Sell |
| 017One Year Average | Both Sides Result for 16 Signals |
Loss: $ -2.14 ($ -0.13 / Signal) |
All of Them | Buy + Sell |
| Simple Moving Averages (SMA) Period | Value $ | Signal | Exponential Moving Averages (EMA) Period | Value $ | Signal | |
|---|---|---|---|---|---|---|
| 2 | 199.32 | SELL | 2 | 199.32 | SELL | |
| 3 | 199.47 | SELL | 3 | 199.35 | SELL | |
| 5 | 199.26 | BUY | 5 | 199.44 | SELL | |
| 8 | 199.59 | SELL | 8 | 199.60 | SELL | |
| 13 | 200.12 | SELL | 13 | 199.93 | SELL | |
| 21 | 200.37 | SELL | 21 | 200.47 | SELL | |
| 34 | 201.97 | SELL | 34 | 200.93 | SELL | |
| 55 | 202.66 | SELL | 55 | 200.74 | SELL | |
| 90 | 199.23 | BUY | 90 | 199.56 | SELL | |
| 200 | 195.94 | BUY | 200 | 194.46 | BUY |
Marsh & Mclennan Cos
IPO: 1969-06-04
Ticker: MMCIndices: S&P 500,
Exchange: New York Stock Exchange, Inc. (US - USD)
Website: https://www.mmc.com/
Phone:
Common Stock
Finance (
Insurance Agents, Brokers & Service
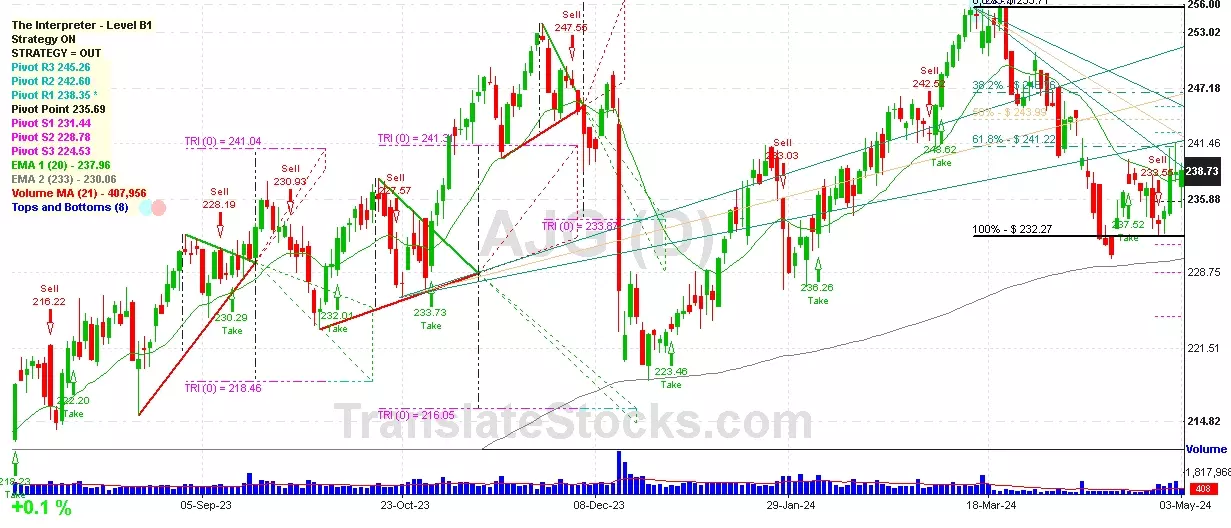
 Click to Enlarge