| Date | Price $ | Result % | Candle Name | Side |
|---|---|---|---|---|
| 001 21 Feb 2024 | Buy Price: 57.10 | Loss: Close Day2 ($ 56.78) | Abandoned Baby | Buy |
| 002 09 Feb 2024 | Buy Price: 56.58 | Profit: Open Day1 ($ 56.59) | Engulfing | Buy |
| 003 08 Feb 2024 | Sell Price: 56.24 | Profit: Open Day1 ($ 55.98) | Abandoned Baby | Sell |
| 004 08 Feb 2024 | Sell Price: 56.29 | Profit: Open Day1 ($ 55.98) | Engulfing | Sell |
| 005 03 Nov 2023 | Sell Price: 59.38 | Profit: Close Day1 ($ 59.04) | Dark Cloud Cover | Sell |
| 006 07 Sep 2023 | Buy Price: 66.25 | Profit: Open Day1 ($ 66.26) | Abandoned Baby | Buy |
| 007 14 Jul 2023 | Sell Price: 73.20 | Profit: Open Day1 ($ 72.96) | Abandoned Baby | Sell |
| 008 30 May 2023 | Sell Price: 72.69 | Profit: Open Day1 ($ 72.64) | Engulfing | Sell |
| 009One Year Average | Both Sides Result for 8 Signals |
Profit: $ 0.90 ($ 0.11 / Signal) |
All of Them | Buy + Sell |
| Simple Moving Averages (SMA) Period | Value $ | Signal | Exponential Moving Averages (EMA) Period | Value $ | Signal | |
|---|---|---|---|---|---|---|
| 2 | 66.45 | SELL | 2 | 66.23 | SELL | |
| 3 | 66.48 | SELL | 3 | 66.22 | SELL | |
| 5 | 66.19 | SELL | 5 | 65.96 | BUY | |
| 8 | 65.38 | BUY | 8 | 65.52 | BUY | |
| 13 | 64.50 | BUY | 13 | 64.93 | BUY | |
| 21 | 64.26 | BUY | 21 | 64.11 | BUY | |
| 34 | 62.89 | BUY | 34 | 62.98 | BUY | |
| 55 | 60.32 | BUY | 55 | 61.81 | BUY | |
| 90 | 60.04 | BUY | 90 | 61.12 | BUY | |
| 200 | 61.50 | BUY | 200 | 62.90 | BUY |
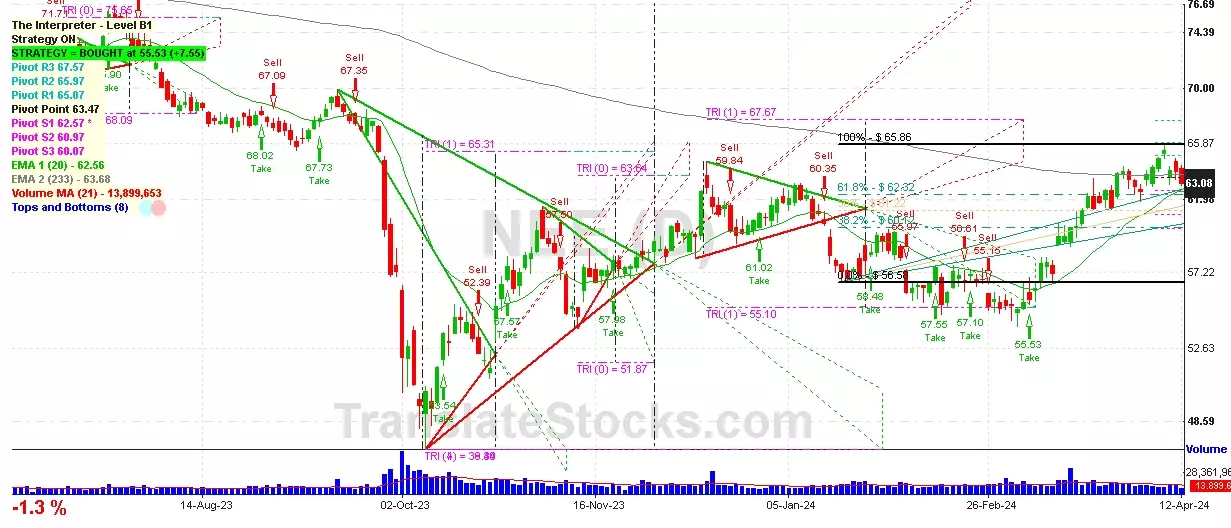
Nextera Energy Inc
IPO: 1950-02-15
Ticker: NEEIndices: S&P 500,
Exchange: New York Stock Exchange, Inc. (US - USD)
Website: http://www.nexteraenergy.com
Phone:
Common Stock
Energy & Transportation (
Electric Services

 Click to Enlarge