| Date | Price $ | Result % | Candle Name | Side |
|---|---|---|---|---|
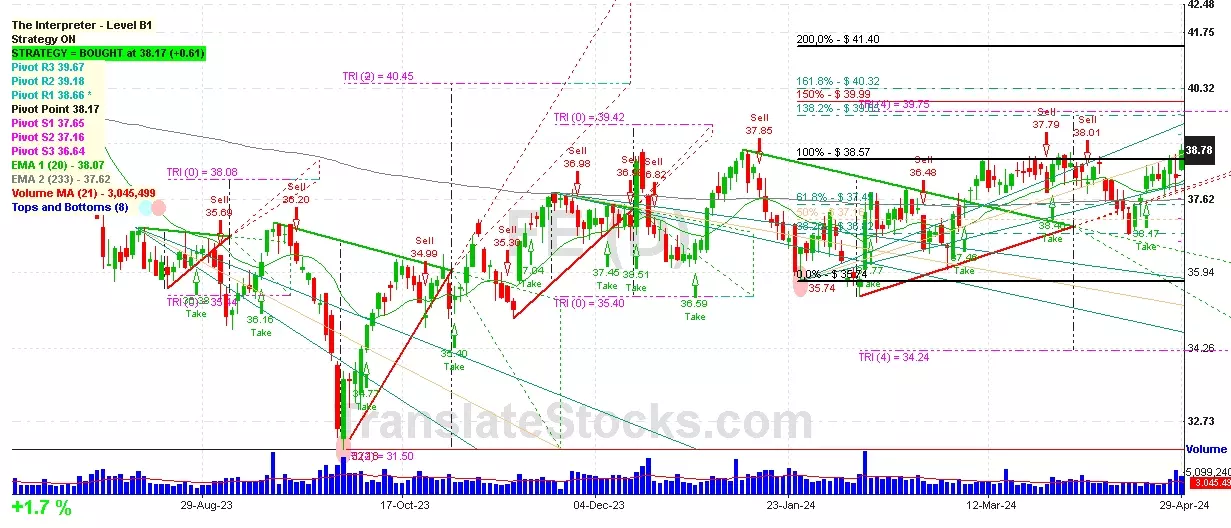
| 001 08 Nov 2023 | Buy Price: 45.68 | Loss: Close Day2 ($ 45.55) | Piercing Line | Buy |
| 002 30 Oct 2023 | Buy Price: 42.25 | Profit: Close Day1 ($ 42.38) | Engulfing | Buy |
| 003 23 Oct 2023 | Buy Price: 40.64 | Profit: Open Day1 ($ 41.18) | Piercing Line | Buy |
| 004 17 Aug 2023 | Sell Price: 36.77 | Profit: Open Day1 ($ 36.66) | Engulfing | Sell |
| 005 14 Aug 2023 | Buy Price: 37.00 | Profit: Open Day2 ($ 37.10) | Engulfing | Buy |
| 006 14 Aug 2023 | Buy Price: 37.01 | Profit: Open Day2 ($ 37.10) | Piercing Line | Buy |
| 007 10 Aug 2023 | Sell Price: 36.93 | Profit: Close Day1 ($ 36.66) | Engulfing | Sell |
| 008 27 Jul 2023 | Sell Price: 37.32 | Loss: Close Day2 ($ 37.99) | Abandoned Baby | Sell |
| 009 18 Jul 2023 | Buy Price: 36.96 | Profit: Open Day1 ($ 37.00) | Engulfing | Buy |
| 010One Year Average | Both Sides Result for 9 Signals |
Profit: $ 0.49 ($ 0.05 / Signal) |
All of Them | Buy + Sell |
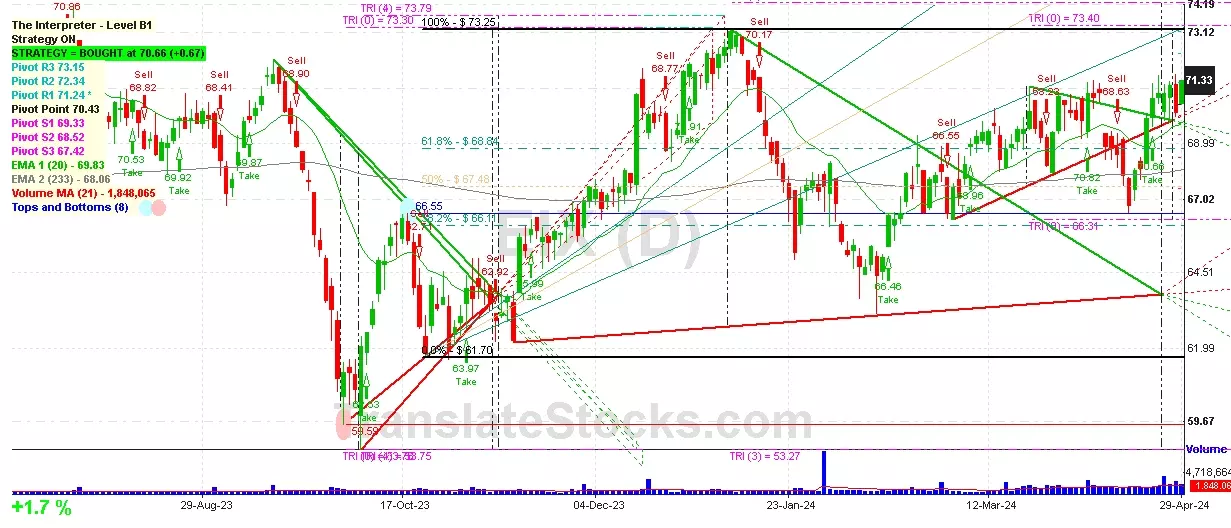
| Simple Moving Averages (SMA) Period | Value $ | Signal | Exponential Moving Averages (EMA) Period | Value $ | Signal | |
|---|---|---|---|---|---|---|
| 2 | 73.38 | BUY | 2 | 73.55 | BUY | |
| 3 | 73.21 | BUY | 3 | 73.27 | BUY | |
| 5 | 72.74 | BUY | 5 | 72.89 | BUY | |
| 8 | 71.83 | BUY | 8 | 72.61 | BUY | |
| 13 | 72.62 | BUY | 13 | 72.23 | BUY | |
| 21 | 72.29 | BUY | 21 | 71.21 | BUY | |
| 34 | 69.75 | BUY | 34 | 69.03 | BUY | |
| 55 | 64.09 | BUY | 55 | 65.65 | BUY | |
| 90 | 59.40 | BUY | 90 | 61.17 | BUY | |
| 200 | 49.35 | BUY | 200 | 52.81 | BUY |
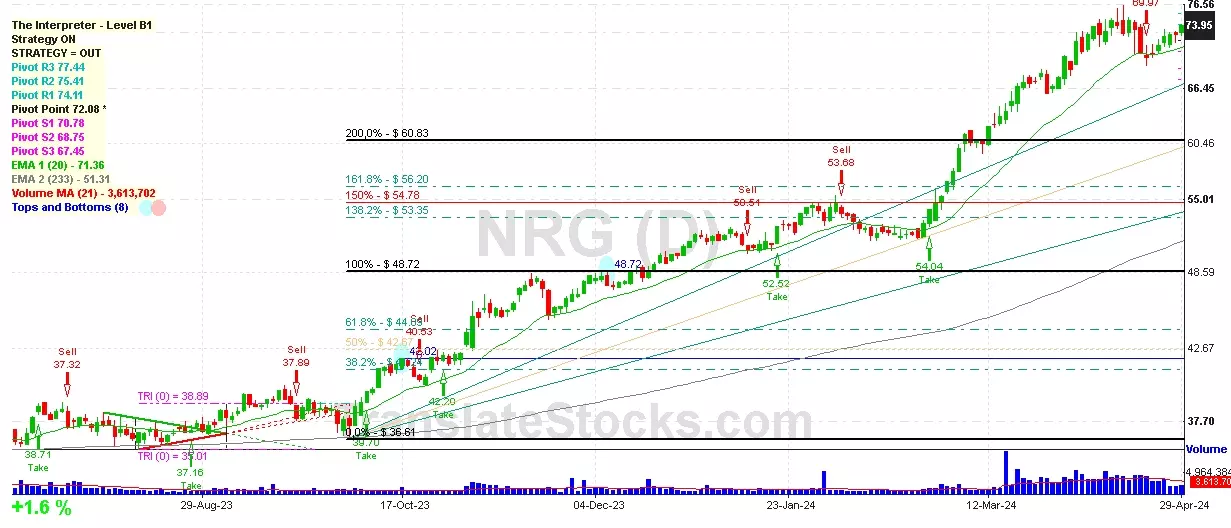
Nrg Energy Inc
IPO: 2004-03-25
Ticker: NRGIndices: S&P 500,
Exchange: New York Stock Exchange, Inc. (US - USD)
Website: http://www.nrgenergy.com
Phone:
Common Stock
Energy & Transportation (
Electric Services

 Click to Enlarge