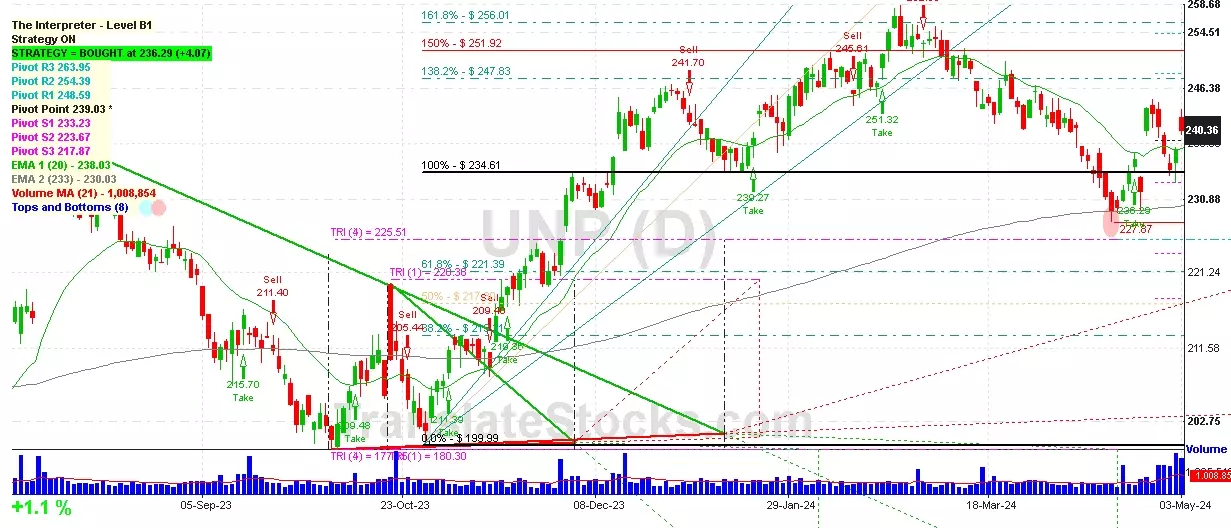
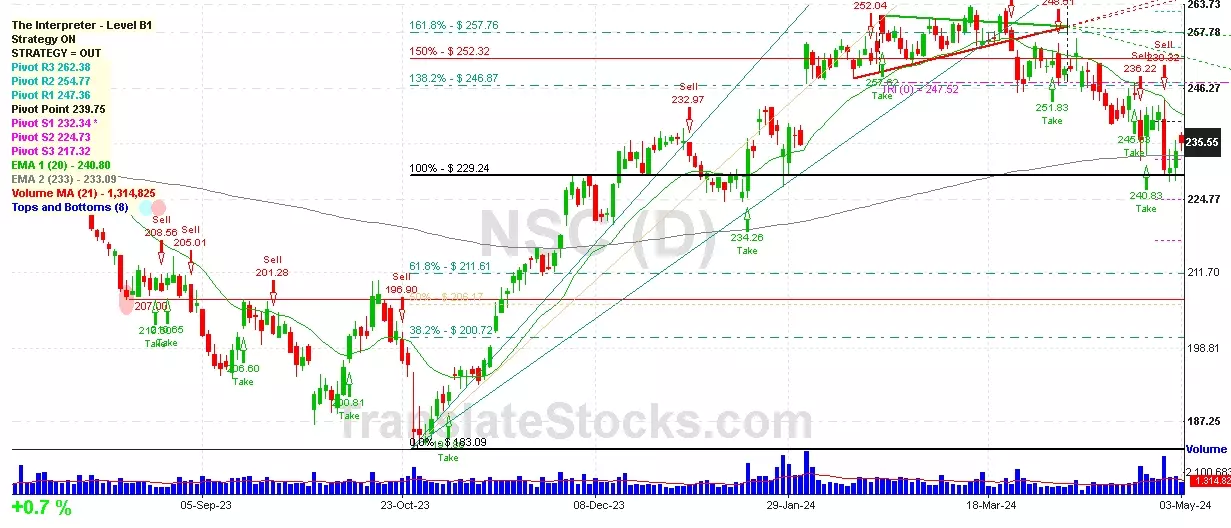
Hey Friend, I'm analysing NORFOLK SOUTHERN CORP (NSC), and it is between the Support of $ 232.34 (PivotS1) and the Resistance of $ 239.75 (Pivot). The stock is also approaching the line of PivotS1 at $ 232.34, and if it goes below this line it could reach the next Support of 100% of Fibonacci at $ 229.24.

| Date | Price $ | Result % | Candle Name | Side |
|---|---|---|---|---|
| 001 27 Mar 2024 | Buy Price: 251.72 | Profit: Open Day1 ($ 252.57) | Abandoned Baby | Buy |
| 002 18 Mar 2024 | Buy Price: 256.22 | Profit: Open Day1 ($ 256.68) | Abandoned Baby | Buy |
| 003 22 Feb 2024 | Sell Price: 256.19 | Profit: Close Day2 ($ 254.55) | Abandoned Baby | Sell |
| 004 21 Dec 2023 | Buy Price: 234.42 | Profit: Open Day1 ($ 234.96) | Engulfing | Buy |
| 005 08 Nov 2023 | Buy Price: 194.81 | Profit: Open Day1 ($ 195.66) | Abandoned Baby | Buy |
| 006 06 Oct 2023 | Buy Price: 192.02 | Profit: Close Day1 ($ 195.75) | Engulfing | Buy |
| 007 06 Oct 2023 | Buy Price: 191.51 | Profit: Close Day1 ($ 195.75) | Piercing Line | Buy |
| 008 21 Jul 2023 | Sell Price: 233.01 | Profit: Open Day1 ($ 232.98) | Abandoned Baby | Sell |
| 009 12 Jul 2023 | Sell Price: 230.97 | Loss: Close Day2 ($ 234.78) | Engulfing | Sell |
| 010 12 Jul 2023 | Sell Price: 231.04 | Loss: Close Day2 ($ 234.78) | Dark Cloud Cover | Sell |
| 011 01 Jun 2023 | Buy Price: 212.21 | Profit: Open Day1 ($ 214.23) | Abandoned Baby | Buy |
| 012 16 May 2023 | Sell Price: 212.69 | Loss: Close Day2 ($ 216.17) | Abandoned Baby | Sell |
| 013 16 May 2023 | Sell Price: 212.46 | Loss: Close Day2 ($ 216.17) | Engulfing | Sell |
| 014 08 May 2023 | Sell Price: 207.08 | Profit: Open Day1 ($ 206.32) | Dark Cloud Cover | Sell |
| 015One Year Average | Both Sides Result for 14 Signals |
Profit: $ 0.38 ($ 0.03 / Signal) |
All of Them | Buy + Sell |
| Simple Moving Averages (SMA) Period | Value $ | Signal | Exponential Moving Averages (EMA) Period | Value $ | Signal | |
|---|---|---|---|---|---|---|
| 2 | 234.68 | BUY | 2 | 234.73 | BUY | |
| 3 | 233.31 | BUY | 3 | 234.49 | BUY | |
| 5 | 234.34 | BUY | 5 | 234.97 | BUY | |
| 8 | 236.09 | SELL | 8 | 236.23 | SELL | |
| 13 | 238.40 | SELL | 13 | 238.33 | SELL | |
| 21 | 242.21 | SELL | 21 | 241.10 | SELL | |
| 34 | 246.39 | SELL | 34 | 243.80 | SELL | |
| 55 | 250.24 | SELL | 55 | 244.62 | SELL | |
| 90 | 245.85 | SELL | 90 | 241.93 | SELL | |
| 200 | 226.13 | BUY | 200 | 233.96 | BUY |
Norfolk Southern Corp
IPO: 1982-06-02
Ticker: NSCIndices: S&P 500,
Exchange: New York Stock Exchange, Inc. (US - USD)
Website: http://www.nscorp.com/
Phone:
Common Stock
Energy & Transportation (
Railroads, Line-haul Operating
 Click to Enlarge