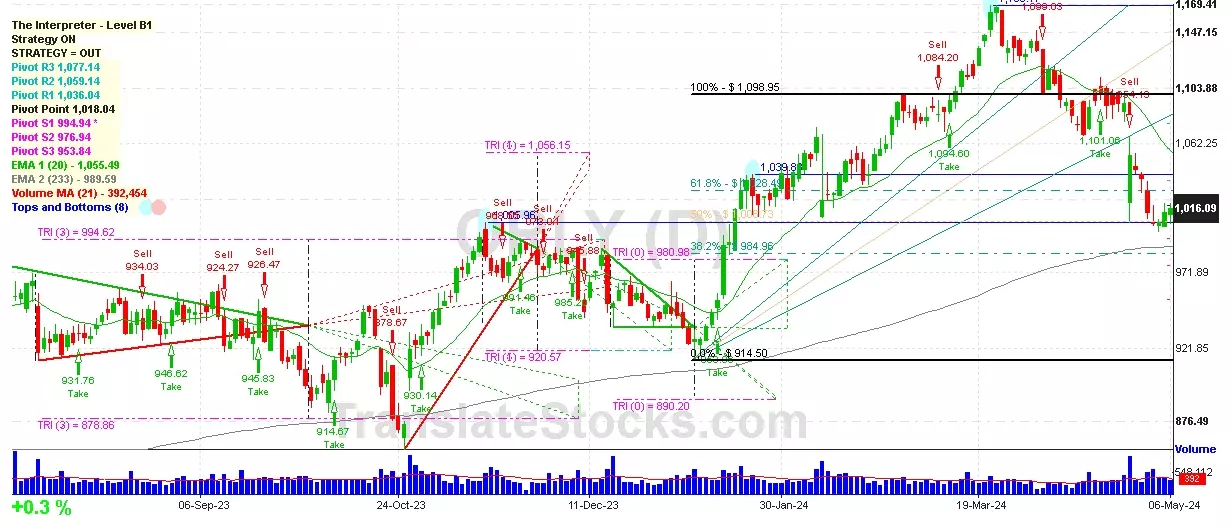
Hey Friend, I'm analysing O'REILLY AUTOMOTIVE INC (ORLY), and it is between the Support of $ 1,006.73 (50% of Fibonacci) and the Resistance of $ 1,018.04 (Pivot). The stock is also approaching the line of Pivot at $ 1,018.04, and if it goes above this line it could reach the next Resistance of 61.8% of Fibonacci at $ 1,028.49.

| Date | Price $ | Result % | Candle Name | Side |
|---|---|---|---|---|
| 001 02 May 2024 | Buy Price: 1,006.23 | Profit: Close Day1 ($ 1,012.95) | Engulfing | Buy |
| 002 27 Mar 2024 | Buy Price: 1,135.52 | Profit: Open Day1 ($ 1,140.97) | Abandoned Baby | Buy |
| 003 29 Feb 2024 | Sell Price: 1,087.42 | Profit: Open Day1 ($ 1,085.71) | Dark Cloud Cover | Sell |
| 004 20 Feb 2024 | Sell Price: 1,035.63 | Loss: Close Day2 ($ 1,054.81) | Abandoned Baby | Sell |
| 005 20 Dec 2023 | Sell Price: 950.25 | Loss: Close Day2 ($ 952.06) | Abandoned Baby | Sell |
| 006 11 Dec 2023 | Buy Price: 965.52 | Profit: Open Day1 ($ 971.82) | Abandoned Baby | Buy |
| 007 25 Oct 2023 | Buy Price: 874.92 | Profit: Open Day1 ($ 904.00) | Piercing Line | Buy |
| 008 29 Sep 2023 | Sell Price: 908.86 | Profit: Close Day1 ($ 898.62) | Engulfing | Sell |
| 009 21 Sep 2023 | Sell Price: 926.47 | Profit: Open Day1 ($ 921.16) | Engulfing | Sell |
| 010 11 Sep 2023 | Sell Price: 942.50 | Profit: Open Day1 ($ 942.45) | Engulfing | Sell |
| 011 06 Jun 2023 | Sell Price: 885.93 | Profit: Open Day1 ($ 884.00) | Engulfing | Sell |
| 012 17 May 2023 | Buy Price: 939.43 | Profit: Close Day1 ($ 941.80) | Engulfing | Buy |
| 013 17 May 2023 | Buy Price: 939.72 | Profit: Close Day1 ($ 941.80) | Piercing Line | Buy |
| 014One Year Average | Both Sides Result for 13 Signals |
Profit: $ 50.25 ($ 3.87 / Signal) |
All of Them | Buy + Sell |
| Simple Moving Averages (SMA) Period | Value $ | Signal | Exponential Moving Averages (EMA) Period | Value $ | Signal | |
|---|---|---|---|---|---|---|
| 2 | 1,014.52 | BUY | 2 | 1,014.47 | BUY | |
| 3 | 1,011.76 | BUY | 3 | 1,014.29 | BUY | |
| 5 | 1,010.73 | BUY | 5 | 1,018.11 | SELL | |
| 8 | 1,023.59 | SELL | 8 | 1,027.26 | SELL | |
| 13 | 1,050.56 | SELL | 13 | 1,041.42 | SELL | |
| 21 | 1,065.07 | SELL | 21 | 1,056.99 | SELL | |
| 34 | 1,092.17 | SELL | 34 | 1,068.06 | SELL | |
| 55 | 1,087.66 | SELL | 55 | 1,067.58 | SELL | |
| 90 | 1,053.50 | SELL | 90 | 1,052.88 | SELL | |
| 200 | 992.71 | BUY | 200 | 1,003.01 | BUY |
O'reilly Automotive Inc
IPO: 1993-04-22
Ticker: ORLYIndices: S&P 500,
Nasdaq 100,
Exchange: Nasdaq Nms - Global Market (US - USD)
Website: https://corporate.oreillyauto.com/corporate/
Phone:
Common Stock
Trade & Services (
Retail-auto & Home Supply Stores
 Click to Enlarge