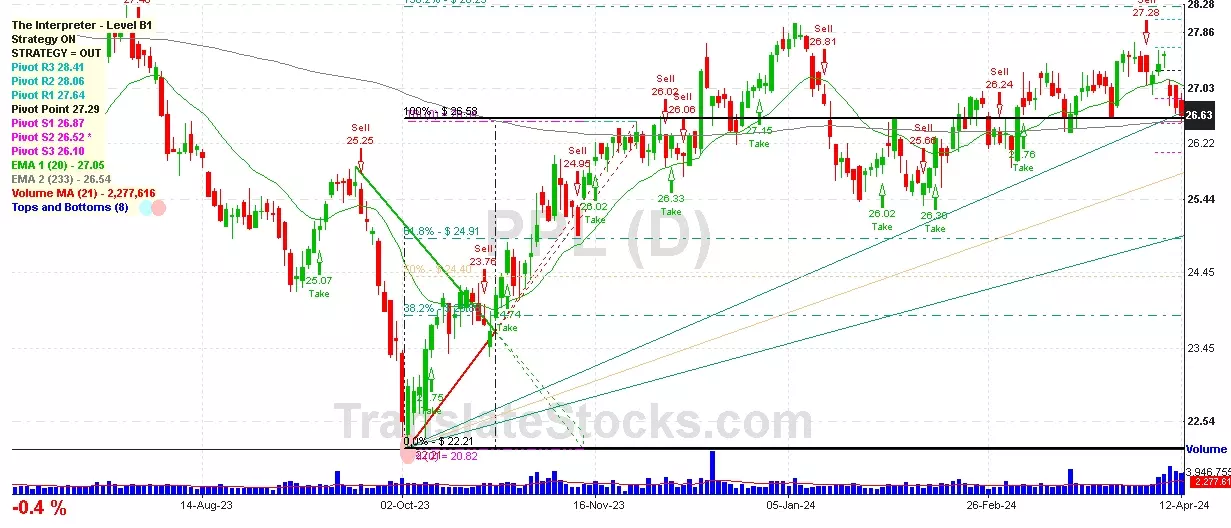
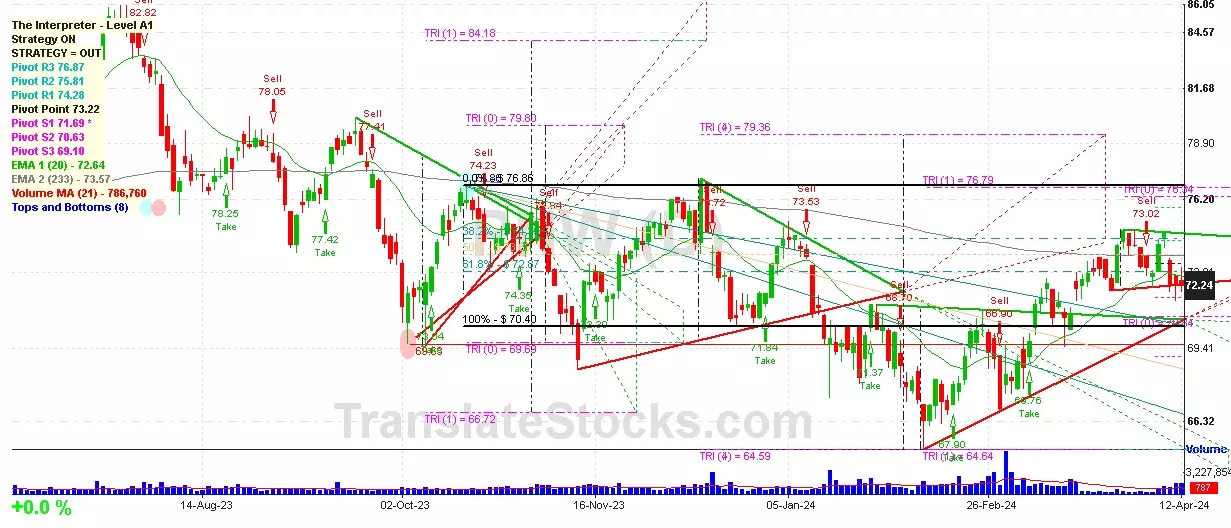
Hey Friend, I'm analysing PINNACLE WEST CAPITAL (PNW), and it is between the Support of $ 71.69 (PivotS1) and the Resistance of $ 72.87 (61.8% of Fibonacci). The stock is also approaching the line of PivotS1 at $ 71.69, and if it goes below this line it could reach the next Support of Triangle projection at $70.84.

| Date | Price $ | Result % | Candle Name | Side |
|---|---|---|---|---|
| 001 08 Apr 2024 | Buy Price: 74.08 | Profit: Open Day1 ($ 74.35) | Abandoned Baby | Buy |
| 002 06 Feb 2024 | Buy Price: 68.08 | Profit: Open Day1 ($ 68.44) | Engulfing | Buy |
| 003 11 Dec 2023 | Buy Price: 75.65 | Profit: Open Day1 ($ 75.70) | Piercing Line | Buy |
| 004 19 Sep 2023 | Sell Price: 78.93 | Profit: Close Day2 ($ 78.40) | Dark Cloud Cover | Sell |
| 005 13 Sep 2023 | Buy Price: 77.42 | Profit: Open Day1 ($ 77.92) | Engulfing | Buy |
| 006 24 Aug 2023 | Sell Price: 78.79 | Loss: Close Day2 ($ 78.82) | Abandoned Baby | Sell |
| 007 02 Jun 2023 | Buy Price: 77.36 | Profit: Close Day1 ($ 77.76) | Engulfing | Buy |
| 008 02 Jun 2023 | Buy Price: 77.43 | Profit: Close Day1 ($ 77.76) | Piercing Line | Buy |
| 009 11 May 2023 | Sell Price: 80.56 | Profit: Close Day2 ($ 80.15) | Dark Cloud Cover | Sell |
| 010 02 May 2023 | Sell Price: 78.44 | Profit: Close Day1 ($ 78.42) | Engulfing | Sell |
| 011One Year Average | Both Sides Result for 10 Signals |
Profit: $ 2.85 ($ 0.28 / Signal) |
All of Them | Buy + Sell |
| Simple Moving Averages (SMA) Period | Value $ | Signal | Exponential Moving Averages (EMA) Period | Value $ | Signal | |
|---|---|---|---|---|---|---|
| 2 | 73.95 | SELL | 2 | 73.90 | SELL | |
| 3 | 74.14 | SELL | 3 | 74.00 | SELL | |
| 5 | 74.33 | SELL | 5 | 73.99 | SELL | |
| 8 | 73.87 | SELL | 8 | 73.83 | SELL | |
| 13 | 73.15 | BUY | 13 | 73.59 | BUY | |
| 21 | 73.40 | BUY | 21 | 73.25 | BUY | |
| 34 | 72.93 | BUY | 34 | 72.75 | BUY | |
| 55 | 71.32 | BUY | 55 | 72.28 | BUY | |
| 90 | 71.17 | BUY | 90 | 72.24 | BUY | |
| 200 | 74.08 | SELL | 200 | 73.34 | BUY |
Pinnacle West Capital
IPO: 1961-08-28
Ticker: PNWIndices: S&P 500,
Exchange: New York Stock Exchange, Inc. (US - USD)
Website: http://www.pinnaclewest.com/
Phone:
Common Stock
Energy & Transportation (
Electric Services
 Click to Enlarge