| Date | Price $ | Result % | Candle Name | Side |
|---|---|---|---|---|
| 001 01 Apr 2024 | Sell Price: 116.29 | Profit: Open Day2 ($ 116.24) | Abandoned Baby | Sell |
| 002 05 Mar 2024 | Buy Price: 108.93 | Profit: Open Day1 ($ 109.52) | Engulfing | Buy |
| 003 01 Mar 2024 | Sell Price: 108.01 | Profit: Open Day1 ($ 107.60) | Abandoned Baby | Sell |
| 004 23 Feb 2024 | Sell Price: 108.07 | Profit: Open Day1 ($ 107.87) | Dark Cloud Cover | Sell |
| 005 10 Jan 2024 | Buy Price: 103.72 | Profit: Open Day2 ($ 104.00) | Engulfing | Buy |
| 006 02 Jan 2024 | Buy Price: 104.57 | Loss: Close Day2 ($ 102.88) | Engulfing | Buy |
| 007 06 Dec 2023 | Sell Price: 97.93 | Loss: Close Day2 ($ 100.87) | Dark Cloud Cover | Sell |
| 008 06 Nov 2023 | Sell Price: 91.81 | Profit: Open Day1 ($ 91.29) | Engulfing | Sell |
| 009 11 Aug 2023 | Buy Price: 95.21 | Loss: Close Day2 ($ 93.29) | Piercing Line | Buy |
| 010 08 Aug 2023 | Sell Price: 97.31 | Profit: Open Day1 ($ 97.23) | Abandoned Baby | Sell |
| 011 31 May 2023 | Sell Price: 78.69 | Loss: Close Day2 ($ 83.04) | Abandoned Baby | Sell |
| 012One Year Average | Both Sides Result for 11 Signals |
Loss: $ -8.77 ($ -0.80 / Signal) |
All of Them | Buy + Sell |
| Simple Moving Averages (SMA) Period | Value $ | Signal | Exponential Moving Averages (EMA) Period | Value $ | Signal | |
|---|---|---|---|---|---|---|
| 2 | 110.84 | SELL | 2 | 110.86 | SELL | |
| 3 | 111.48 | SELL | 3 | 111.05 | SELL | |
| 5 | 111.59 | SELL | 5 | 111.07 | SELL | |
| 8 | 110.58 | SELL | 8 | 111.04 | SELL | |
| 13 | 110.33 | BUY | 13 | 111.28 | SELL | |
| 21 | 112.50 | SELL | 21 | 111.64 | SELL | |
| 34 | 113.06 | SELL | 34 | 111.53 | SELL | |
| 55 | 111.13 | SELL | 55 | 110.45 | BUY | |
| 90 | 108.34 | BUY | 90 | 108.15 | BUY | |
| 200 | 100.95 | BUY | 200 | 103.01 | BUY |
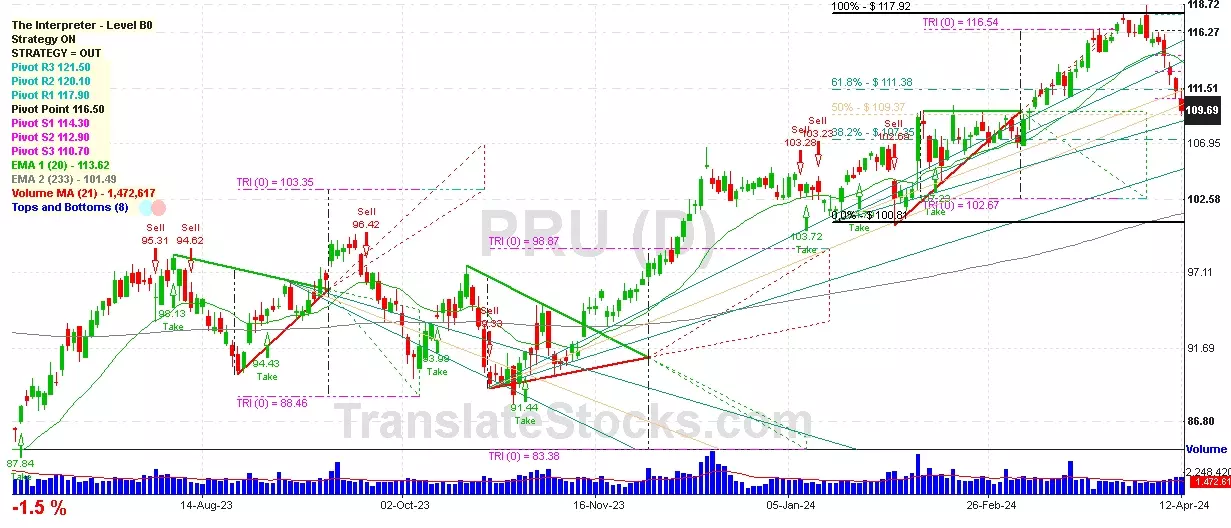
Prudential Financial Inc
IPO: 2001-12-13
Ticker: PRUIndices: S&P 500,
Exchange: New York Stock Exchange, Inc. (US - USD)
Website: https://www.prudential.com/
Phone:
Common Stock
Finance (
Life Insurance

 Click to Enlarge