| Date | Price $ | Result % | Candle Name | Side |
|---|---|---|---|---|
| 001 11 Apr 2024 | Buy Price: 288.52 | Profit: Open Day2 ($ 288.82) | Engulfing | Buy |
| 002 10 Apr 2024 | Sell Price: 282.06 | Profit: Open Day1 ($ 282.04) | Abandoned Baby | Sell |
| 003 14 Mar 2024 | Sell Price: 280.00 | Profit: Open Day1 ($ 278.10) | Engulfing | Sell |
| 004 13 Mar 2024 | Buy Price: 284.38 | Profit: Open Day1 ($ 285.84) | Piercing Line | Buy |
| 005 11 Mar 2024 | Sell Price: 284.79 | Profit: Close Day1 ($ 283.88) | Abandoned Baby | Sell |
| 006 21 Feb 2024 | Buy Price: 274.63 | Profit: Open Day1 ($ 278.07) | Piercing Line | Buy |
| 007 29 Jan 2024 | Buy Price: 304.62 | Profit: Close Day1 ($ 307.22) | Piercing Line | Buy |
| 008 18 Jan 2024 | Buy Price: 300.15 | Profit: Open Day1 ($ 301.39) | Abandoned Baby | Buy |
| 009 03 Nov 2023 | Buy Price: 263.70 | Loss: Close Day2 ($ 257.02) | Abandoned Baby | Buy |
| 010 02 Nov 2023 | Sell Price: 258.60 | Profit: Close Day2 ($ 258.50) | Abandoned Baby | Sell |
| 011 13 Oct 2023 | Sell Price: 288.32 | Loss: Close Day2 ($ 290.55) | Abandoned Baby | Sell |
| 012 05 Sep 2023 | Sell Price: 307.20 | Profit: Open Day2 ($ 306.97) | Abandoned Baby | Sell |
| 013 14 Aug 2023 | Buy Price: 299.16 | Loss: Close Day2 ($ 295.15) | Engulfing | Buy |
| 014 31 May 2023 | Sell Price: 278.60 | Profit: Open Day1 ($ 278.22) | Abandoned Baby | Sell |
| 015One Year Average | Both Sides Result for 14 Signals |
Loss: $ -0.34 ($ -0.02 / Signal) |
All of Them | Buy + Sell |
| Simple Moving Averages (SMA) Period | Value $ | Signal | Exponential Moving Averages (EMA) Period | Value $ | Signal | |
|---|---|---|---|---|---|---|
| 2 | 274.72 | SELL | 2 | 273.32 | SELL | |
| 3 | 274.49 | SELL | 3 | 273.52 | SELL | |
| 5 | 272.65 | SELL | 5 | 273.68 | SELL | |
| 8 | 274.29 | SELL | 8 | 274.10 | SELL | |
| 13 | 274.35 | SELL | 13 | 275.07 | SELL | |
| 21 | 277.54 | SELL | 21 | 276.57 | SELL | |
| 34 | 279.91 | SELL | 34 | 278.40 | SELL | |
| 55 | 281.25 | SELL | 55 | 280.40 | SELL | |
| 90 | 285.55 | SELL | 90 | 282.48 | SELL | |
| 200 | 287.50 | SELL | 200 | 284.72 | SELL |
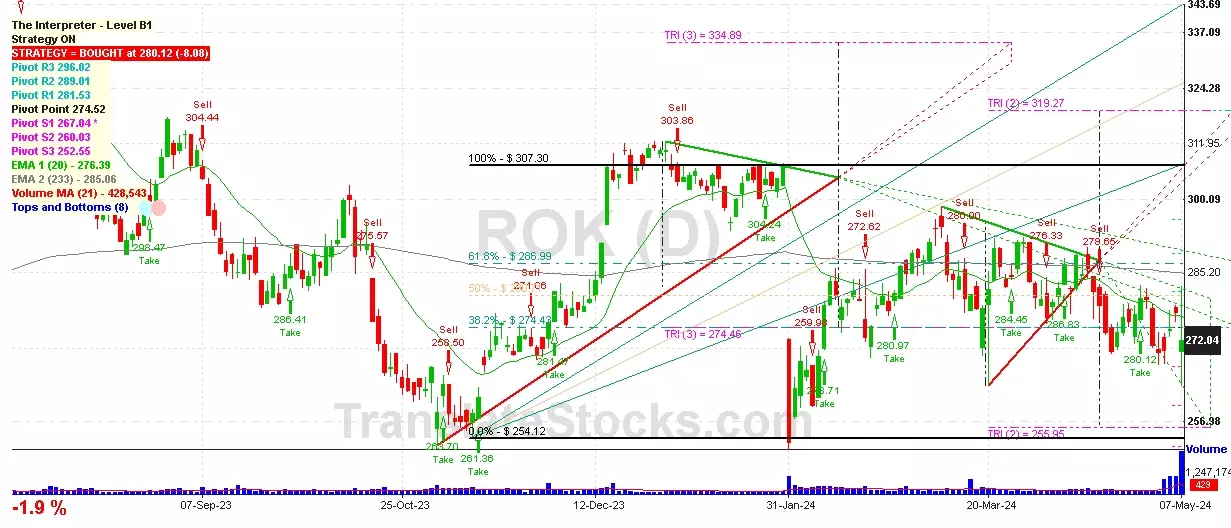
Rockwell Automation Inc
IPO: 1956-08-29
Ticker: ROKIndices: S&P 500,
Exchange: New York Stock Exchange, Inc. (US - USD)
Website: https://www.rockwellautomation.com/
Phone:
Common Stock
Life Sciences (
Measuring & Controlling Devices, Nec

 Click to Enlarge