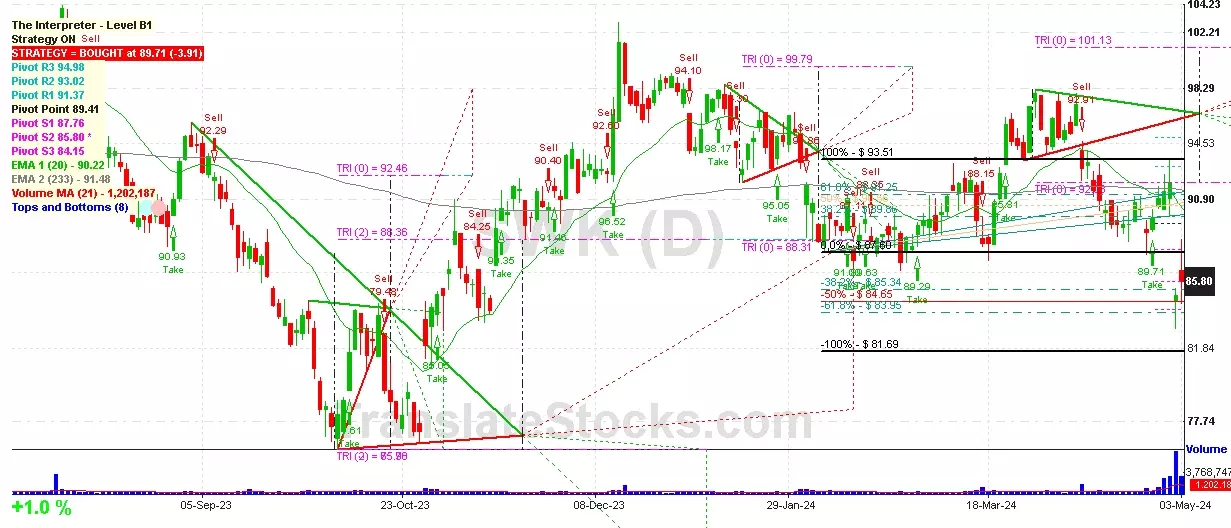
Hey Friend, I'm analysing STANLEY BLACK & DECKER INC (SWK), and it is between the Support of $ 85.80 (PivotS2) and the Resistance of $ 87.60 (0% of Fibonacci). The stock is also approaching the line of PivotS2 at $ 85.80, and if it goes below this line it could reach the next Support of -38.2% of Fibonacci at $ 85.34. Since it is nailed exactly on the line of $ 85.80, we should wait for another day to better understand which side the stock will move to.

| Date | Price $ | Result % | Candle Name | Side |
|---|---|---|---|---|
| 001 03 Apr 2024 | Buy Price: 96.21 | Profit: Open Day1 ($ 97.41) | Abandoned Baby | Buy |
| 002 03 Apr 2024 | Buy Price: 96.24 | Profit: Open Day1 ($ 97.41) | Engulfing | Buy |
| 003 05 Mar 2024 | Sell Price: 88.96 | Loss: Close Day2 ($ 91.12) | Engulfing | Sell |
| 004 20 Feb 2024 | Buy Price: 88.46 | Profit: Open Day1 ($ 88.56) | Piercing Line | Buy |
| 005 08 Feb 2024 | Sell Price: 89.27 | Profit: Open Day1 ($ 89.23) | Abandoned Baby | Sell |
| 006 08 Dec 2023 | Sell Price: 92.85 | Profit: Open Day1 ($ 92.79) | Abandoned Baby | Sell |
| 007 14 Nov 2023 | Buy Price: 89.05 | Profit: Open Day1 ($ 89.56) | Abandoned Baby | Buy |
| 008 23 Jun 2023 | Buy Price: 87.91 | Profit: Close Day1 ($ 89.51) | Engulfing | Buy |
| 009 23 Jun 2023 | Buy Price: 87.81 | Profit: Close Day1 ($ 89.51) | Piercing Line | Buy |
| 010 19 May 2023 | Sell Price: 81.61 | Profit: Open Day1 ($ 81.59) | Engulfing | Sell |
| 011One Year Average | Both Sides Result for 10 Signals |
Profit: $ 4.24 ($ 0.42 / Signal) |
All of Them | Buy + Sell |
| Simple Moving Averages (SMA) Period | Value $ | Signal | Exponential Moving Averages (EMA) Period | Value $ | Signal | |
|---|---|---|---|---|---|---|
| 2 | 85.40 | BUY | 2 | 86.27 | SELL | |
| 3 | 87.56 | SELL | 3 | 86.99 | SELL | |
| 5 | 89.01 | SELL | 5 | 87.93 | SELL | |
| 8 | 89.23 | SELL | 8 | 88.69 | SELL | |
| 13 | 89.38 | SELL | 13 | 89.49 | SELL | |
| 21 | 90.88 | SELL | 21 | 90.29 | SELL | |
| 34 | 92.19 | SELL | 34 | 90.92 | SELL | |
| 55 | 91.16 | SELL | 55 | 91.29 | SELL | |
| 90 | 92.29 | SELL | 90 | 91.33 | SELL | |
| 200 | 90.79 | SELL | 200 | 90.94 | SELL |
Stanley Black & Decker Inc
IPO: 1966-06-15
Ticker: SWKIndices: S&P 500,
Exchange: New York Stock Exchange, Inc. (US - USD)
Website: https://www.stanleyblackanddecker.com/
Phone:
Common Stock
Manufacturing (
Cutlery, Handtools & General Hardware
 Click to Enlarge