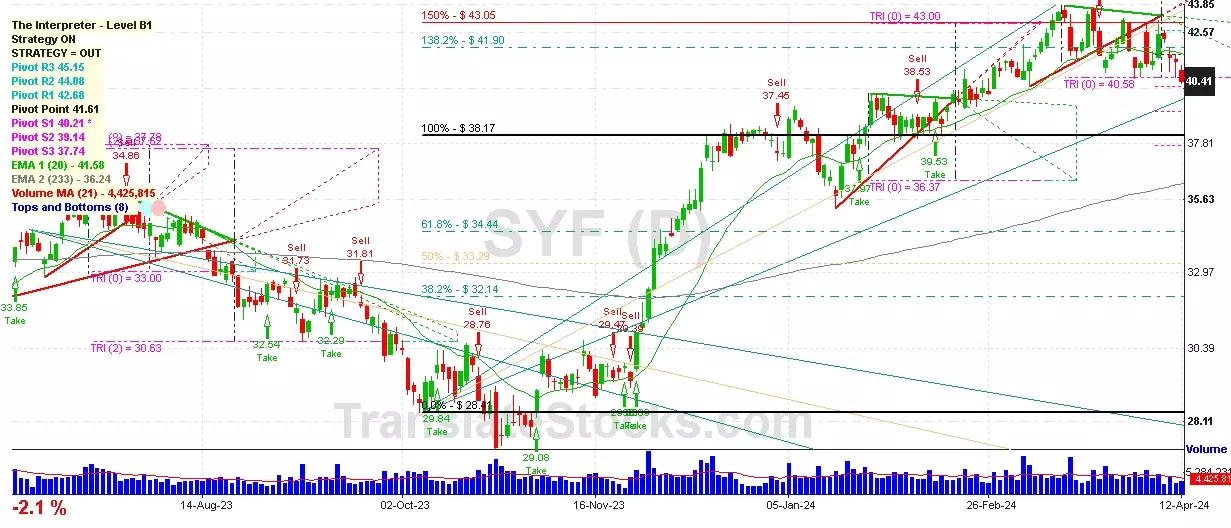
Hey Friend, I'm analysing SYNCHRONY FINANCIAL (SYF), and it is between the Support of $ 40.21 (PivotS1) and the Resistance of $ 40.58 (Triangle Projection Level 0). The stock is also approaching the line of PivotS1 at $ 40.21, and if it goes below this line it could reach the next Support of 100% of Fibonacci at $ 38.17.

| Date | Price $ | Result % | Candle Name | Side |
|---|---|---|---|---|
| 001 05 Mar 2024 | Buy Price: 40.85 | Profit: Open Day1 ($ 40.89) | Piercing Line | Buy |
| 002 20 Feb 2024 | Buy Price: 40.48 | Loss: Close Day2 ($ 39.70) | Engulfing | Buy |
| 003 27 Nov 2023 | Sell Price: 29.39 | Loss: Close Day2 ($ 31.22) | Abandoned Baby | Sell |
| 004 13 Sep 2023 | Sell Price: 31.80 | Loss: Close Day2 ($ 32.52) | Dark Cloud Cover | Sell |
| 005 03 Aug 2023 | Buy Price: 34.30 | Profit: Close Day1 ($ 34.36) | Engulfing | Buy |
| 006 24 Jul 2023 | Buy Price: 35.84 | Profit: Open Day1 ($ 35.89) | Engulfing | Buy |
| 007 24 May 2023 | Sell Price: 30.06 | Profit: Close Day1 ($ 30.00) | Abandoned Baby | Sell |
| 008 11 May 2023 | Buy Price: 27.41 | Profit: Open Day1 ($ 27.67) | Piercing Line | Buy |
| 009One Year Average | Both Sides Result for 8 Signals |
Loss: $ -2.86 ($ -0.36 / Signal) |
All of Them | Buy + Sell |
| Simple Moving Averages (SMA) Period | Value $ | Signal | Exponential Moving Averages (EMA) Period | Value $ | Signal | |
|---|---|---|---|---|---|---|
| 2 | 44.67 | BUY | 2 | 44.61 | BUY | |
| 3 | 44.78 | SELL | 3 | 44.40 | BUY | |
| 5 | 43.87 | BUY | 5 | 43.87 | BUY | |
| 8 | 42.68 | BUY | 8 | 43.24 | BUY | |
| 13 | 41.92 | BUY | 13 | 42.67 | BUY | |
| 21 | 41.87 | BUY | 21 | 42.25 | BUY | |
| 34 | 42.06 | BUY | 34 | 41.83 | BUY | |
| 55 | 41.37 | BUY | 55 | 41.07 | BUY | |
| 90 | 40.09 | BUY | 90 | 39.74 | BUY | |
| 200 | 35.59 | BUY | 200 | 37.08 | BUY |
Synchrony Financial
IPO: 2014-07-31
Ticker: SYFIndices: S&P 500,
Exchange: New York Stock Exchange, Inc. (US - USD)
Website: https://www.synchronyfinancial.com/
Phone:
Common Stock
Finance (
Finance Services
 Click to Enlarge