| Date | Price $ | Result % | Candle Name | Side |
|---|---|---|---|---|
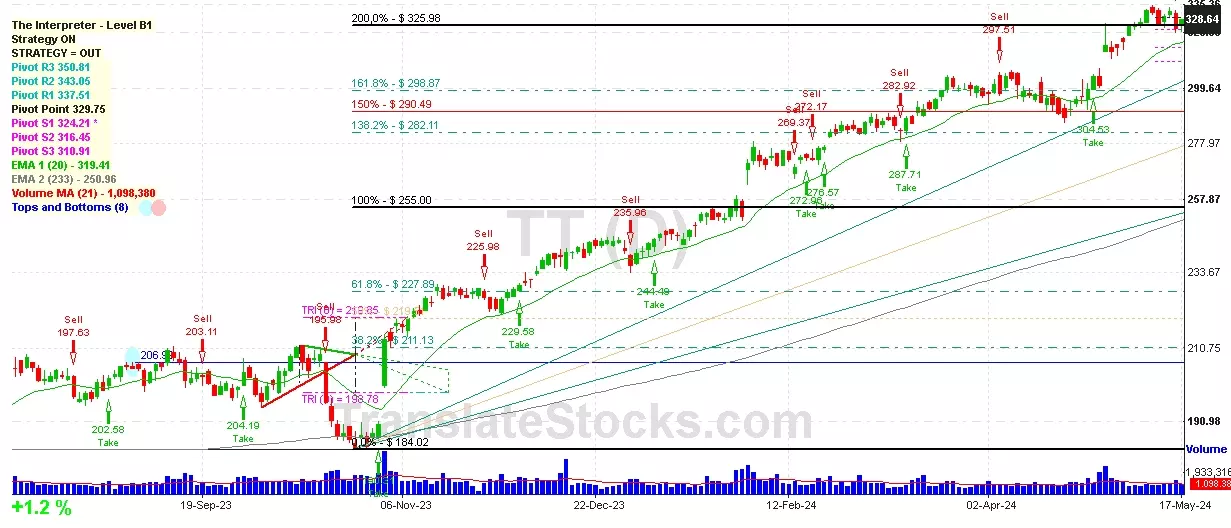
| 001 28 Mar 2024 | Buy Price: 300.51 | Loss: Close Day2 ($ 297.51) | Engulfing | Buy |
| 002 28 Mar 2024 | Buy Price: 300.20 | Loss: Close Day2 ($ 297.51) | Piercing Line | Buy |
| 003 27 Mar 2024 | Buy Price: 299.71 | Profit: Close Day1 ($ 300.20) | Abandoned Baby | Buy |
| 004 16 Feb 2024 | Sell Price: 272.17 | Loss: Close Day2 ($ 276.57) | Abandoned Baby | Sell |
| 005 09 Feb 2024 | Buy Price: 275.44 | Loss: Close Day2 ($ 269.37) | Engulfing | Buy |
| 006 29 Jan 2024 | Buy Price: 254.76 | Profit: Close Day1 ($ 257.75) | Abandoned Baby | Buy |
| 007 29 Jan 2024 | Buy Price: 254.58 | Profit: Close Day1 ($ 257.75) | Engulfing | Buy |
| 008 26 Oct 2023 | Buy Price: 187.43 | Profit: Close Day2 ($ 188.08) | Abandoned Baby | Buy |
| 009 12 Oct 2023 | Sell Price: 206.86 | Profit: Close Day1 ($ 204.69) | Engulfing | Sell |
| 010 29 Sep 2023 | Sell Price: 202.91 | Profit: Open Day1 ($ 202.65) | Dark Cloud Cover | Sell |
| 011 22 Jun 2023 | Sell Price: 184.86 | Profit: Open Day1 ($ 184.02) | Engulfing | Sell |
| 012 20 Jun 2023 | Sell Price: 185.71 | Profit: Open Day1 ($ 185.10) | Abandoned Baby | Sell |
| 013 26 May 2023 | Sell Price: 166.80 | Profit: Close Day1 ($ 166.58) | Engulfing | Sell |
| 014One Year Average | Both Sides Result for 13 Signals |
Loss: $ -4.76 ($ -0.37 / Signal) |
All of Them | Buy + Sell |
| Simple Moving Averages (SMA) Period | Value $ | Signal | Exponential Moving Averages (EMA) Period | Value $ | Signal | |
|---|---|---|---|---|---|---|
| 2 | 326.68 | BUY | 2 | 328.07 | BUY | |
| 3 | 328.55 | BUY | 3 | 328.20 | BUY | |
| 5 | 328.47 | BUY | 5 | 328.25 | BUY | |
| 8 | 329.36 | SELL | 8 | 327.19 | BUY | |
| 13 | 325.96 | BUY | 13 | 323.97 | BUY | |
| 21 | 315.74 | BUY | 21 | 318.81 | BUY | |
| 34 | 308.87 | BUY | 34 | 312.06 | BUY | |
| 55 | 302.61 | BUY | 55 | 302.81 | BUY | |
| 90 | 287.90 | BUY | 90 | 289.08 | BUY | |
| 200 | 247.30 | BUY | 200 | 257.56 | BUY |
Trane Technologies Plc
IPO: 1906-10-10
Ticker: TTIndices: S&P 500,
Exchange: New York Stock Exchange, Inc. (IE - USD)
Website: https://www.tranetechnologies.com/
Phone:
Common Stock
Life Sciences (
Auto Controls For Regulating Residential & Comml Environments

 Click to Enlarge