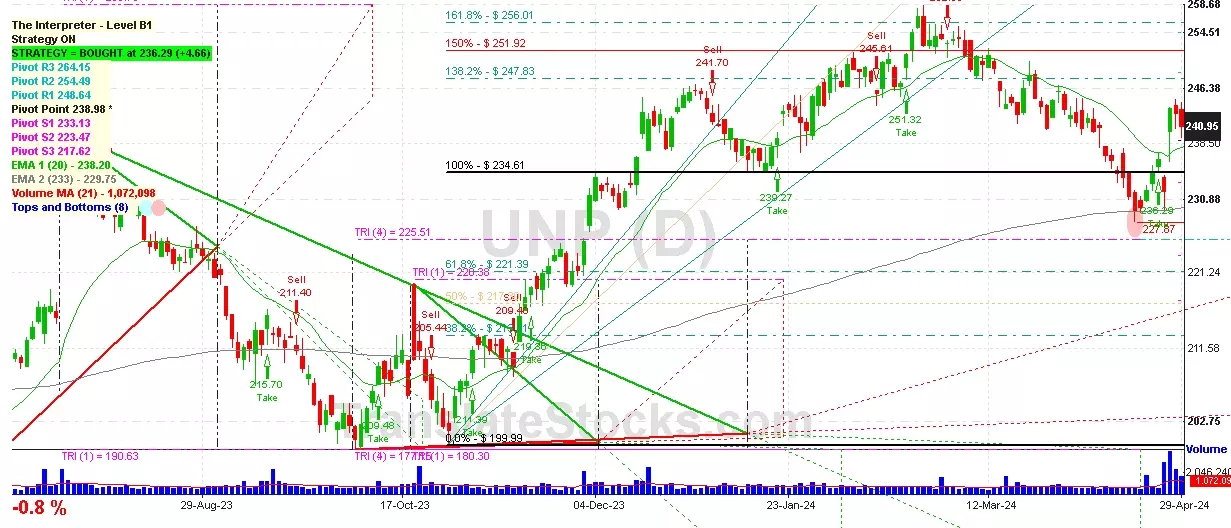
Hey Friend, I'm analysing UNION PACIFIC CORP (UNP), and it is between the Support of $ 238.98 (Pivot) and the Resistance of $ 247.83 (138.2% of Fibonacci). The stock is also approaching the line of Pivot at $ 238.98, and if it goes below this line it could reach the next Support of 100% of Fibonacci at $ 234.61.

| Date | Price $ | Result % | Candle Name | Side |
|---|---|---|---|---|
| 001 01 Apr 2024 | Sell Price: 243.30 | Profit: Open Day1 ($ 242.27) | Abandoned Baby | Sell |
| 002 26 Feb 2024 | Sell Price: 252.64 | Profit: Open Day2 ($ 252.51) | Engulfing | Sell |
| 003 09 Feb 2024 | Buy Price: 249.45 | Loss: Close Day2 ($ 245.61) | Engulfing | Buy |
| 004 08 Jan 2024 | Buy Price: 240.62 | Loss: Close Day2 ($ 239.00) | Piercing Line | Buy |
| 005 14 Nov 2023 | Buy Price: 215.69 | Profit: Open Day1 ($ 216.36) | Abandoned Baby | Buy |
| 006 14 Aug 2023 | Buy Price: 229.80 | Loss: Close Day2 ($ 224.62) | Engulfing | Buy |
| 007 09 Aug 2023 | Buy Price: 229.25 | Profit: Open Day1 ($ 229.97) | Piercing Line | Buy |
| 008 07 Jun 2023 | Buy Price: 201.46 | Profit: Open Day1 ($ 201.47) | Engulfing | Buy |
| 009 06 Jun 2023 | Sell Price: 196.36 | Profit: Open Day1 ($ 196.30) | Abandoned Baby | Sell |
| 010 01 Jun 2023 | Buy Price: 195.68 | Profit: Open Day1 ($ 197.18) | Engulfing | Buy |
| 011One Year Average | Both Sides Result for 10 Signals |
Loss: $ -6.52 ($ -0.65 / Signal) |
All of Them | Buy + Sell |
| Simple Moving Averages (SMA) Period | Value $ | Signal | Exponential Moving Averages (EMA) Period | Value $ | Signal | |
|---|---|---|---|---|---|---|
| 2 | 241.87 | SELL | 2 | 241.26 | SELL | |
| 3 | 242.43 | SELL | 3 | 240.78 | BUY | |
| 5 | 239.11 | BUY | 5 | 239.47 | BUY | |
| 8 | 236.49 | BUY | 8 | 238.18 | BUY | |
| 13 | 235.15 | BUY | 13 | 237.62 | BUY | |
| 21 | 237.38 | BUY | 21 | 238.32 | BUY | |
| 34 | 240.50 | BUY | 34 | 239.87 | BUY | |
| 55 | 244.57 | SELL | 55 | 240.79 | BUY | |
| 90 | 243.84 | SELL | 90 | 239.31 | BUY | |
| 200 | 229.61 | BUY | 200 | 231.42 | BUY |
Union Pacific Corp
IPO: 1969-06-20
Ticker: UNPIndices: S&P 500,
Exchange: New York Stock Exchange, Inc. (US - USD)
Website: http://www.up.com/
Phone:
Common Stock
Energy & Transportation (
Railroads, Line-haul Operating
 Click to Enlarge