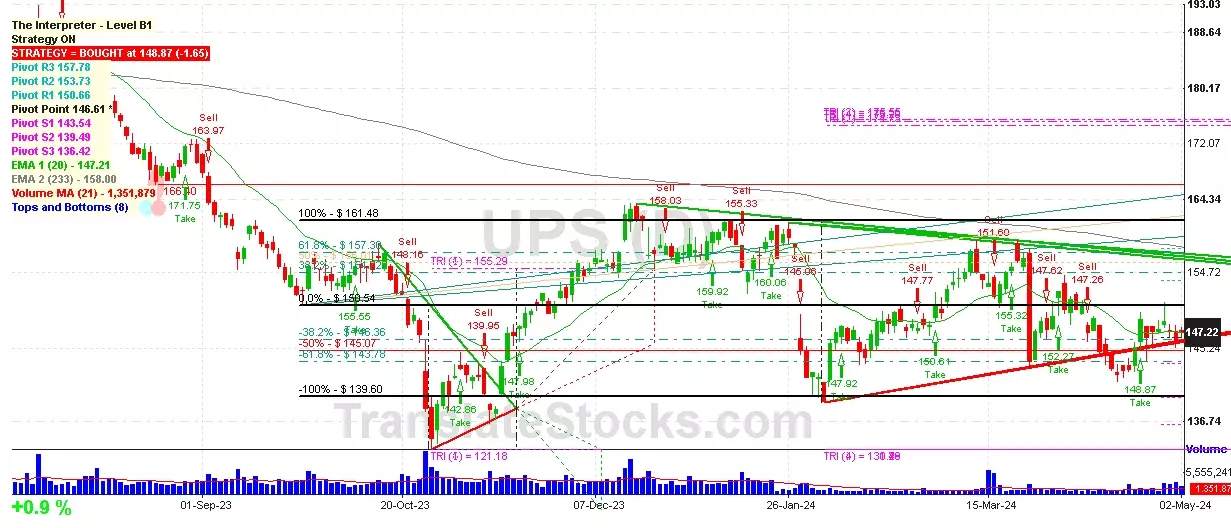
Hey Friend, I'm analysing UNITED PARCEL SERVICE CL B (UPS), and it is between the Support of $ 146.61 (Pivot) and the Resistance of $ 150.54 (0% of Fibonacci). The stock is also approaching the line of Pivot at $ 146.61, and if it goes below this line it could reach the next Support of -38.2% of Fibonacci at $ 146.36.

| Date | Price $ | Result % | Candle Name | Side |
|---|---|---|---|---|
| 001 18 Apr 2024 | Buy Price: 142.74 | Profit: Open Day1 ($ 143.28) | Abandoned Baby | Buy |
| 002 01 Apr 2024 | Sell Price: 147.62 | Loss: Close Day2 ($ 152.27) | Dark Cloud Cover | Sell |
| 003 13 Mar 2024 | Sell Price: 154.76 | Profit: Open Day1 ($ 154.50) | Engulfing | Sell |
| 004 28 Dec 2023 | Buy Price: 157.31 | Profit: Close Day2 ($ 158.34) | Piercing Line | Buy |
| 005 21 Dec 2023 | Buy Price: 157.16 | Profit: Open Day1 ($ 158.00) | Abandoned Baby | Buy |
| 006 30 Nov 2023 | Sell Price: 151.61 | Loss: Close Day2 ($ 155.92) | Dark Cloud Cover | Sell |
| 007 27 Nov 2023 | Sell Price: 149.59 | Loss: Close Day2 ($ 152.29) | Abandoned Baby | Sell |
| 008 13 Sep 2023 | Buy Price: 157.84 | Profit: Open Day1 ($ 159.76) | Engulfing | Buy |
| 009 18 Aug 2023 | Buy Price: 171.43 | Loss: Close Day2 ($ 166.86) | Engulfing | Buy |
| 010 18 Aug 2023 | Buy Price: 171.24 | Loss: Close Day2 ($ 166.86) | Piercing Line | Buy |
| 011 31 Jul 2023 | Sell Price: 187.13 | Profit: Open Day1 ($ 186.86) | Abandoned Baby | Sell |
| 012 26 Jun 2023 | Buy Price: 172.75 | Profit: Open Day1 ($ 173.39) | Engulfing | Buy |
| 013 17 May 2023 | Buy Price: 171.36 | Profit: Open Day1 ($ 171.64) | Abandoned Baby | Buy |
| 014One Year Average | Both Sides Result for 13 Signals |
Loss: $ -14.83 ($ -1.14 / Signal) |
All of Them | Buy + Sell |
| Simple Moving Averages (SMA) Period | Value $ | Signal | Exponential Moving Averages (EMA) Period | Value $ | Signal | |
|---|---|---|---|---|---|---|
| 2 | 146.57 | BUY | 2 | 146.99 | BUY | |
| 3 | 146.87 | BUY | 3 | 147.01 | BUY | |
| 5 | 147.35 | SELL | 5 | 147.03 | BUY | |
| 8 | 147.46 | SELL | 8 | 146.91 | BUY | |
| 13 | 145.82 | BUY | 13 | 146.89 | BUY | |
| 21 | 146.84 | BUY | 21 | 147.26 | SELL | |
| 34 | 148.64 | SELL | 34 | 148.00 | SELL | |
| 55 | 149.26 | SELL | 55 | 148.97 | SELL | |
| 90 | 151.03 | SELL | 90 | 150.48 | SELL | |
| 200 | 155.96 | SELL | 200 | 156.21 | SELL |
United Parcel Service-cl B
IPO: 1999-11-10
Ticker: UPSIndices: S&P 500,
Exchange: New York Stock Exchange, Inc. (US - USD)
Website: https://www.ups.com/
Phone:
Common Stock
Energy & Transportation (
Trucking & Courier Services (no Air)
 Click to Enlarge